See also: Fast Data Science A/B test Calculator (Bayesian)
A/B testing is a way you can test two things, Thing A, and Thing B, to see which is better. You most commonly hear about A/B testing in the context of commercial websites, but A/B testing can be done in a number of different contexts, including offline marketing, and testing prices.
Imagine you are the CEO of an online shoe retailer. You suspect that your outdated website design is putting customers off and they are not buying as many shoes as they would do if you had a better website.
The website greets visitors with a static image of some shoes. You suspect that replacing it with a video could improve conversions.
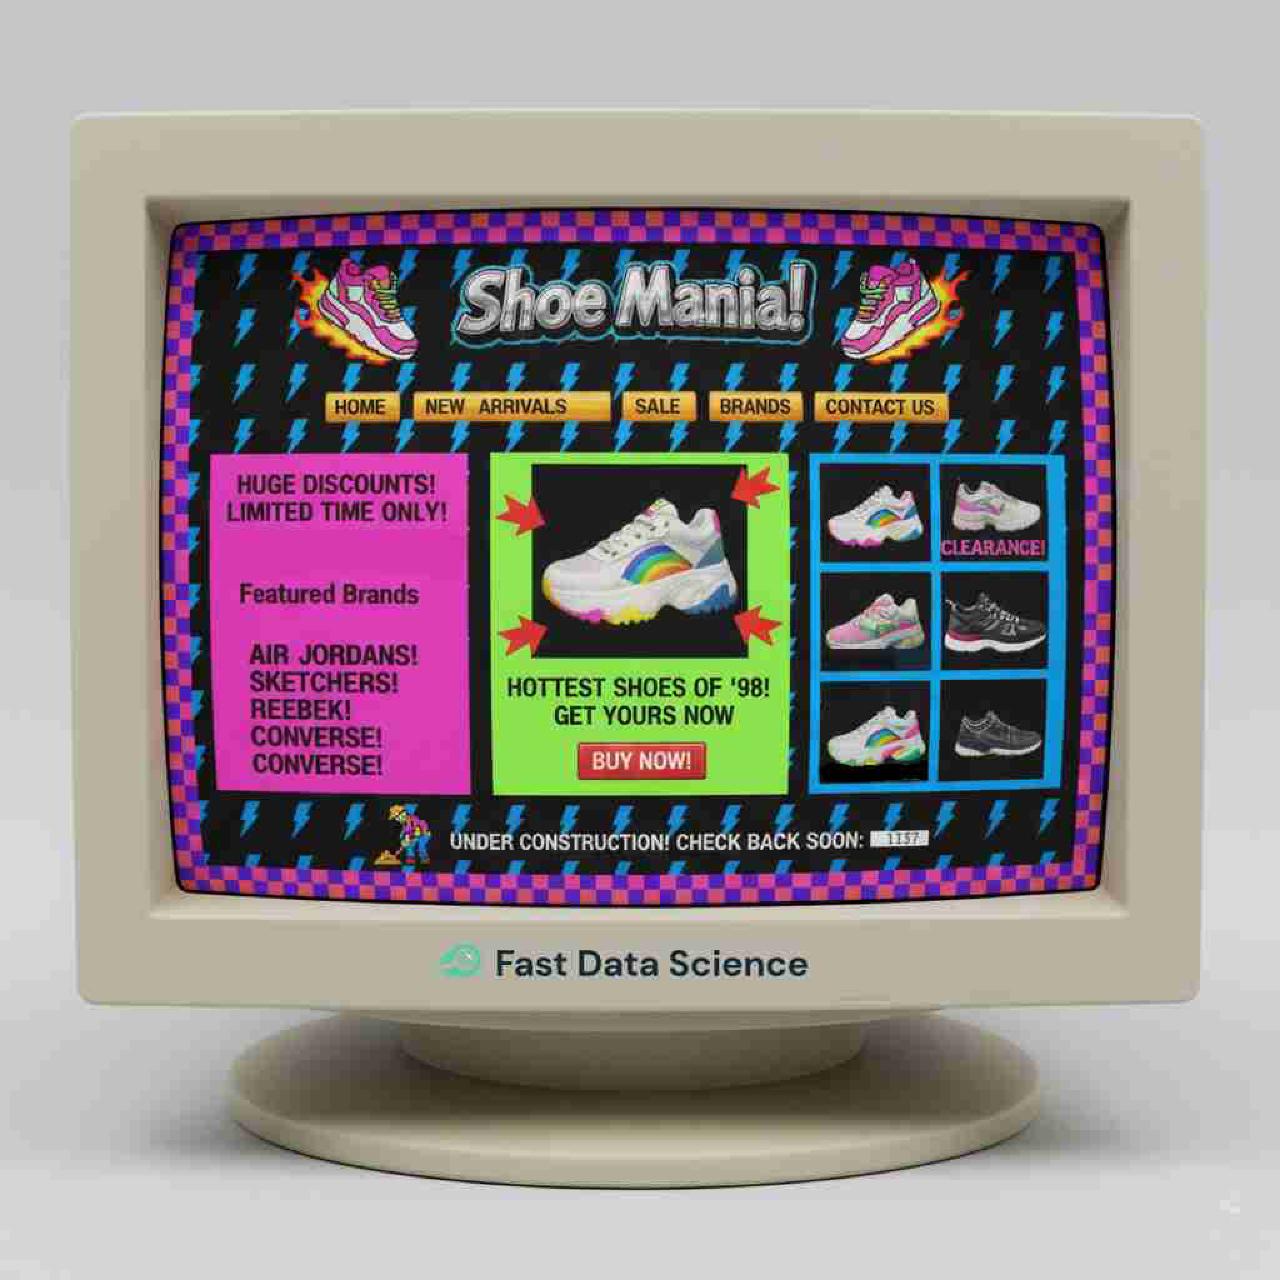

Above: a very outdated shoe website. You can slide to see the more modern design.
Are you very sure that you know what you’re doing, or do you have a robust appetite for risk? You could ask your web developers to come up with a new and improved website and switch the whole website over to that new design. Then just sit back and watch to see if people buy more shoes.
But what if you are just at the start of peak shoe-buying season? Immediately after switching the website to the (you hope) better design, you notice an uptick in sales. How can you attribute that to the new website, when you know that in previous years you saw an uptick around this date anyway?

Above: the (real) user clicks data from https://clinicaltrialrisk.org. What caused the uptick around July 2025?
Instead of trying to tease out what part of the uptick is down to your website redesign and what is down to seasonal effects or other unrelated random noise, you can try something a little bit smarter: you can take each visitor and randomly show them the original version of your website, let’s call it Version A, and show the other half the new version, Version B.
If your numbers are sufficiently large, you can then compare the two groups to see which version performs better and then make a decision. This is A/B testing in a nutshell.
The results of an A/B test are often hard to anticipate. It has been reported that Netflix throws away 90% of the features that they A/B test.[5] Across domains, we see experimental ideas fail frequently, and this highlights just how useful A/B testing is. Without all these A/B tests, many organisations would be regularly rolling out features that do more harm than good.
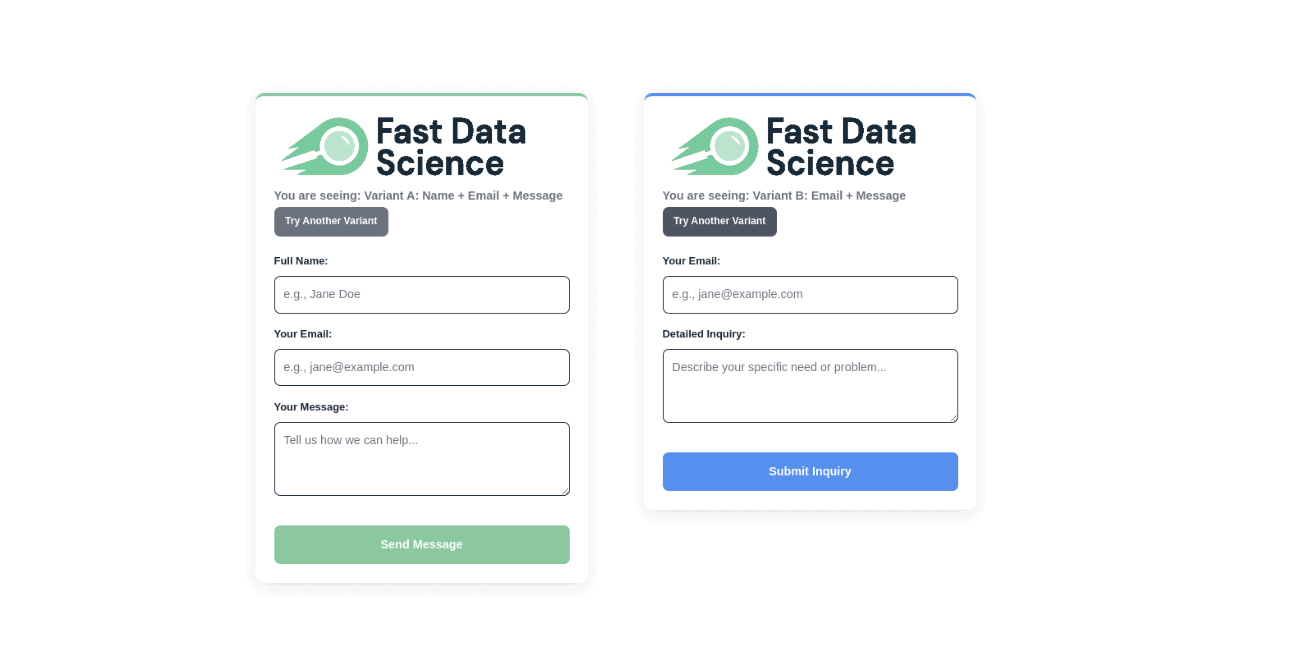
To illustrate A/B testing, I’ve put a real and functioning contact form below which you can fill out and submit.
There are two variants of the contact form design: Variant A and Variant B.
You can click “Try Another Variant” to get a different variant. You may need to click a few times if the same variant keeps coming up, as it is randomised. The variants displayed and the messages sent are all logged, and I can monitor which variant gets more contact requests (conversions).
You can see the results of the form above in the significance calculator below.
Try clicking “Try Another Variant” above a few times, and try submitting a few enquiries and then refresh the Significance Calculator view below.
I am doing a Chi-Squared test to find out if there is a difference between Variant A and Variant B. I should point out that in a real experiment you would define the length of the experiment and conduct the Chi-Squared analysis only once. Doing it multiple times is “peeking” and invalidates your statistical test.
You’ll see the results of what you did with the contact form coming in in real time!
Loading data...
χ² Statistic: 0.0000 (Critical Value for p < 0.05 is approx 3.841)
When you are trying out a variant of your website, you will have the original version of the site and the new version that you’re testing. The users who see the original version are your control group. A control group is needed for the same reason that a control group is needed in a clinical trial: you need something to compare against. How will you know if your variant design is causing an improvement, when you have nothing to compare against?
Its important to decide on your hypothesis before doing your A/B test, so that you know what you’re testing for. Your hypothesis could be that your new design will improve conversions, or that a new button design will improve clicks, or that disgruntled employees are more responsive to emails full of job offers on a Monday morning at 8am than they are on a Saturday at 5pm.
The metrics are what you will measure in your A/B test. It could be simply the number of contact requests that come in, or alternatively the number of contact requests per view. It could be purchases, products added to a shopping card, or the bounce rate (the number of users who navigate away from the page). For a charity, non-profit or political organisation, common metrics could be the number or the amount of donations, or the number of signups to a newsletter.
I will first describe the traditional “frequentist” approach to statistical testing.
Imagine you have 100 users which have seen Variant A, and 100 users that have seen Variant B. Thirty of the Variant A users converted and twenty of the Variant B users converted. So the conversion rates are 30% (= 30/100) for Variant A and 20% (= 20/100) for Variant B. Would this be sufficient evidence to decide in favour of Variant A?
It’s not enough to just look at the averages and say, “this looks good enough”. For a robust decision, you need to do a statistical test. 100 users in each category is very small and the difference between the performance of the two variants could just be down to random chance.
There are a number of statistical tests that could be used to analyse this problem, but the most straightforward in this case is the Chi-Squared test for independence (χ² test).
I am going to choose a two-tailed test (this means that we don’t know before running our A/B test whether A or B is going to win). I am also going to use a confidence level of 95%. This means that if there were no true difference between A and B, and we repeated our A/B test 100 times, 5% of the time the test would report a false positive due to random chance alone.
Our statistical test will output a value called p. If p < 0.025, then the difference between our two variants is significant.
We put all the data into a table called a contingency table:
| Conversion | No Conversion | Total Views | |
|---|---|---|---|
| Variant A | 30 | 70 | 100 |
| Variant B | 20 | 80 | 100 |
| Total | 50 | 150 | 200 |
We can then put the values in the contingency table into a Chi-Squared lookup table, or use software to get the Chi-Squared statistic.
I have a short program below in Python which will run our Chi-Squared test for the above data.
import numpy as np
import scipy.stats as stats

visitors_a = 100
conversions_a = 30
visitors_b = 100
conversions_b = 20

cvr_a = conversions_a/visitors_a
cvr_b = conversions_b/visitors_b

print (f"Conversion rates: A: {cvr_a:.02f}, B: {cvr_b:.02f}")

table = np.array([[conversions_a, visitors_a - conversions_a],
                  [conversions_b, visitors_b - conversions_b]])

chi2, p, _, _ = stats.chi2_contingency(table)

print (f"p = {p:0.2f}, χ² = {chi2:.02f}")

if p < 0.025: # This is a two-tailed test so we test against 0.025 and not 0.05
    print ("The difference between the two variants is significant.")
else:
    print ("The difference between the two variants is not significant.")
Here is the output of the program:
Conversion rates: A: 0.30, B: 0.20
p = 0.14, χ² = 2.16
The difference between the two variants is not significant.
I was curious to see, what happens if we took the A/B test that I did above, and just made all numbers 10 times bigger. The conversion rates are still 30% and 20%.
visitors_a = 1000
conversions_a = 300
visitors_b = 1000
conversions_b = 200
Running the program above with the large numbers gives a very different result:
p = 0.00, χ² = 26.14
The difference between the two variants is significant.
This shows that you will generally need to run your A/B tests for a decent amount of time so that you can collect data from enough users to draw a conclusion. Peeking early and making decisions on the state of your A/B test before it’s completed will invalidate the experiment.
The frequentist statistical tests described above can lead to a lot of confusion. People often think that the p-value represents the probability that Variant B is better or worse than Variant A, when really it represents something very different.
So how can we get the probability that B is better than A?
The frequentist approach described above originates from the early 1900s, when statisticians were developing a new field of maths that would allow them to decide whether the yield of crops from a particular field is better than the yield from a different field[2], or whether a particular batch of beer is better than another.[3]
The online marketing industry is gradually moving towards Bayesian A/B testing as a standard, which does output the probability of a variant being better than another.
I have put a Bayesian A/B test calculator on our website so you can try it with your real data. Given four numbers, the number of impressions for variants A and B and the number of conversions for A and B, the Bayesian method will give you the probability that B is better than A. Typically we do this by generating a large number (10,000 in this case) of random variables.
It’s a bit more involved to calculate a Bayesian probability in an A/B test. The Bayesian A/B test calculator I made shows Python and R code which you can use.
Bayesian A/B testing relies on Monte Carlo simulations. It simulates 100,000 samples from a distribution and uses this to calculate the approximate probability that B beats A. The conversion rates for both variants are treated as random variables following a Beta distribution. You can read more about the technical details in [6, 7]:
Enter your visitor and conversion data to calculate the probability that Variant B is better than Variant A.
Calculating...
Result
So that you can understand how the Bayesian A/B test probability is being calculated, the Python code will appear below when you run the Bayesian A/B test calculator.
First you need to install some dependencies:
pip install scipy numpy
# Python code will appear here.
You can also run the code in R:
# R code will appear here.
For email marketing, you can test not just the content of your emails, but also the timing. You can email half of your mailing list on a Monday and half on a Friday and see which day performs better. Email marketing platforms let you track a number of metrics, such as open rates (measured via a transparent tracking pixel) and response rates.
It may initially appear complex to implement variant pricing in your A/B tests. Most A/B testing involves varying the front end without any back end changes, but if you wanted to A/B test two price variants, you would need to bring the A/B testing all the way back into your pricing platform.
A simple way to achieve this would be to have a single price in your back end, which is your lower price, and implement your price variants in the front end only. For example, an item could retail at $11 or $12, and the back end price (the price in your database) could remain at $11. If a user goes through the entire flow of the $12 variant, they could be offered a $1 discount right at the final step.
Alternatively, many SaaS companies use third party solutions such as Stripe, Square, or Zettle to collect payments. Stripe offers an A/B testing functionality, so you can implement price A/B testing starting in the back end.
A/B testing can even be done with entirely physical media. We have taken on consulting engagements for an offline marketing company, where brand ambassadors are stationed at locations in cities with heavy footfall. Each brand ambassador has a stack of 800 promotional flyers with QR codes on them. If you want to assess which flyer design performs best, you can print 400 flyers with Design A and 400 with Design B, and shuffle them. If you keep track of which QR code corresponds to which design, you have an A/B test right there. You can also follow this approach to test locations and timings, but you would need to run this test on a number of days to eliminate confounding factors (e.g. one brand ambassador being more charismatic than another).
In 2007, Dan Siroker, co-founder of Optimizely and author of A/B Testing: The Most Powerful Way to Turn Clicks Into Customers[1], left a job at Google to join Barack Obama’s campaign as part of Obama’s the “new media” team. Siroker described later how his team experimented with four different labels for a sign up button, as well as a number of different images and videos on Obama’s campaign website. The team found that (surprisingly) images outperformed videos, and by switching to a “Family Image” (a picture of Barack Obama with his wife and daughters) and a button saying “Learn More” translated into a 40.6 percent lift in signups, 2.8 million more subscribers, and $57 million in extra donations. All from A/B testing!

President Barack Obama. Official White House Photo by Pete Souza. Image is a work of the U.S. federal government, and is in the public domain.
At Fast Data Science, for one of our clients in the recruitment industry, we found that the online form used for signups had a large number of fields. Website monitoring showed that users lingered for a long time on a few complicated dropdowns and we suspected that this was causing a drop-off. We conducted an A/B test with an 80-20 split and found that removing one of the problematic fields would cause a 7% increase in signups. The client company proceeded to roll out the improved form on the website following the hard evidence of the A/B test.
There is another field where many of the same experimental designs and statistical techniques are used as in A/B testing: randomised controlled trials (RCTs). In an RCT, typically you want to compare one drug to another, or a drug to no drug.
Let’s take a real life example of a clinical trial for surgery for rectal cancer. The trial involved 306 patients divided roughly into 4 groups (these would correspond to variants). Some groups received only radiotherapy and others received radiotherapy and surgery. The endpoint (what would be called a “metric” in A/B testing parlance) was a reduction in size of the tumour. The trial results showed that patients could have health outcomes after radiation that are as good as the outcomes from surgery, showing that surgery can be avoided in some cases.
I have mentioned randomised controlled trials because it’s an interesting application of the same statistics as you would use in A/B testing, and we are doing a lot of work with RCTs both on our product, the Clinical Trial Risk Tool and in our consulting engagements.
In order to be able to run A/B tests, you need many experimental units. In the case of a website, the experimental units are typically your users. Normally you would need thousands of experimental units to run the test. In a clinical trial, the experimental units are usually subjects or patients, but the experimental units can sometimes be mother baby pairs, villages, or households.
Inevitably, some decisions cannot be A/B tested. You cannot run an A/B testing on a complete SEO restructure of your website, because you only have one domain. You also can’t run an A/B test on a company merger, because there is only one company.[5]
A/B tests will not be the solution to every problem. There are a number of situations where it is not advisable to conduct an A/B test.
A/B testing relies on statistical significance to confidently attribute a difference in performance to the change being tested. If your website or app doesn’t receive enough traffic, you won’t gather the necessary sample size quickly. This forces you to run the test for an excessively long time (weeks or months), which risks confounding the results with external factors (e.g., seasonality, new marketing campaigns) or delays product development unnecessarily. Similarly, if the desired event (e.g., purchase, or sign-up) is infrequent, you won’t gather enough data points to reach a statistically significant conclusion.
You may have a website that is so terrible, that the redesign is obvious and you are planning to do the redesign anyway. If an A/B test would have no effect on your decision, there is no point in doing it. For example, if you discover that your website’s payment page is completely broken, then there is no point in A/B testing the fix, and the delay resulting from the A/B test would result in financial loss. If the outcome of the A/B test will not change your decision, don’t do it!
A/B tests can slow you down and sometimes you just need to go ahead and make the change. You may be in an early stage startup and need to roll out a new feature, before you run out of money and everybody loses their job.
Siroker and Koomen, in their book A/B testing: The most powerful way to turn clicks into customers, said that there’s a joke that almost any variant of a button loses to a button that says “free beer”.[1] In other words, you need to keep the A/B testing appropriate to your company. At some point you need to sell your product and that’s what you’re optimising for.
In many large companies, the website can be the crown jewels - it is where all custom comes from. The website going down for a day would result in lost revenue and reputational damage. It can be very hard work to convince the people responsible in a company to allow you to run A/B testing. Getting executive buy-in can be one of the biggest blockers in data science, and often it is far more insurmountable than any of the technical challenges we face.
Of course, A/B testing does not need to be a 50-50 split. Sometimes you can overcome these objections by offering a 90-10 split, so at worst, only 10% of the user traffic would be affected by the alternative design.
In developing our flagship product, the Clinical Trial Risk Tool, we have conducted a lot of qualitative user experience (UX) research. We have had so far five separate recorded video calls with a UX designer and target users (clinical trial managers). The users have gone through the process of using the tool without prompting from us (the developers). This process has unearthed problems that would have been hard to find with A/B testing.
For example, an earlier iteration of the Clinical Trial Risk Tool had a “download PDF” button in a prominent position at the top of the user interface.

We found that nearly all users were downloading a PDF export from the tool and never returning to the web interface. What was worse, was that the PDF export at that time had been implemented as a bit of an afterthought - it was not the main functionality of the product at all, and a lot of information and functionality that was displayed in the web interface had not yet been brought over to the PDF export. A number of users had mentioned in messages that the output was “wrong” and the tool was “broken”, but until we saw users downloading the PDF and becoming perplexed by its content, we had had no idea that the “broken” features were all in this PDF export - simply because it was not our focus.
It would have taken a long time to get this degree of nuanced insights from A/B testing, since the users and developers were entirely at odds in their understanding of where the functionality of the product was located.
We have since learnt to keep PDF and Excel exports in less prominent positions in the software, so that users are encouraged to stay within the tool.
Siroker, Dan, and Pete Koomen. A/B testing: The most powerful way to turn clicks into customers. John Wiley & Sons, 2015.
Fisher, Ronald A. “Studies in crop variation. I. An examination of the yield of dressed grain from Broadbalk.” The Journal of Agricultural Science 11.2 (1921): 107-135.
Student (pseudonym of William Sealy Gosset), “The probable error of a mean.” Biometrika (1908): 1-25., retrieved from https://www.york.ac.uk/depts/maths/histstat/student.pdf, 18 October 2025
Thomas, C. R., et al. Phase 2 Timing of Rectal Cancer Response to Chemoradiation: Analysis of Radiation Therapy (RT). International Journal of Radiation Oncology, Biology, Physics 87.2 (2013): S88.
Kohavi, Ron, Diane Tang, and Ya Xu. Trustworthy online controlled experiments: A practical guide to a/b testing. Cambridge University Press, 2020.
Idan Michaeli, Frequentist vs. Bayesian approach in A/B testing, https://www.dynamicyield.com/lesson/bayesian-testing/, retrieved 20 October 2025
Ibtesam Ahmed, Beginner’s guide to Bayesian AB testing, https://medium.com/@ibtesamahmex/beginners-guide-to-bayesian-ab-testing-22f40988d5e6, retrieved 20 October 2025
Looking for experts in Natural Language Processing? Post your job openings with us and find your ideal candidate today!
Post a Job
None of the content of this article constitutes investment advice. Few would dispute that the global economy is currently in an AI boom. However, opinions are divided over whether this boom also constitutes a bubble.
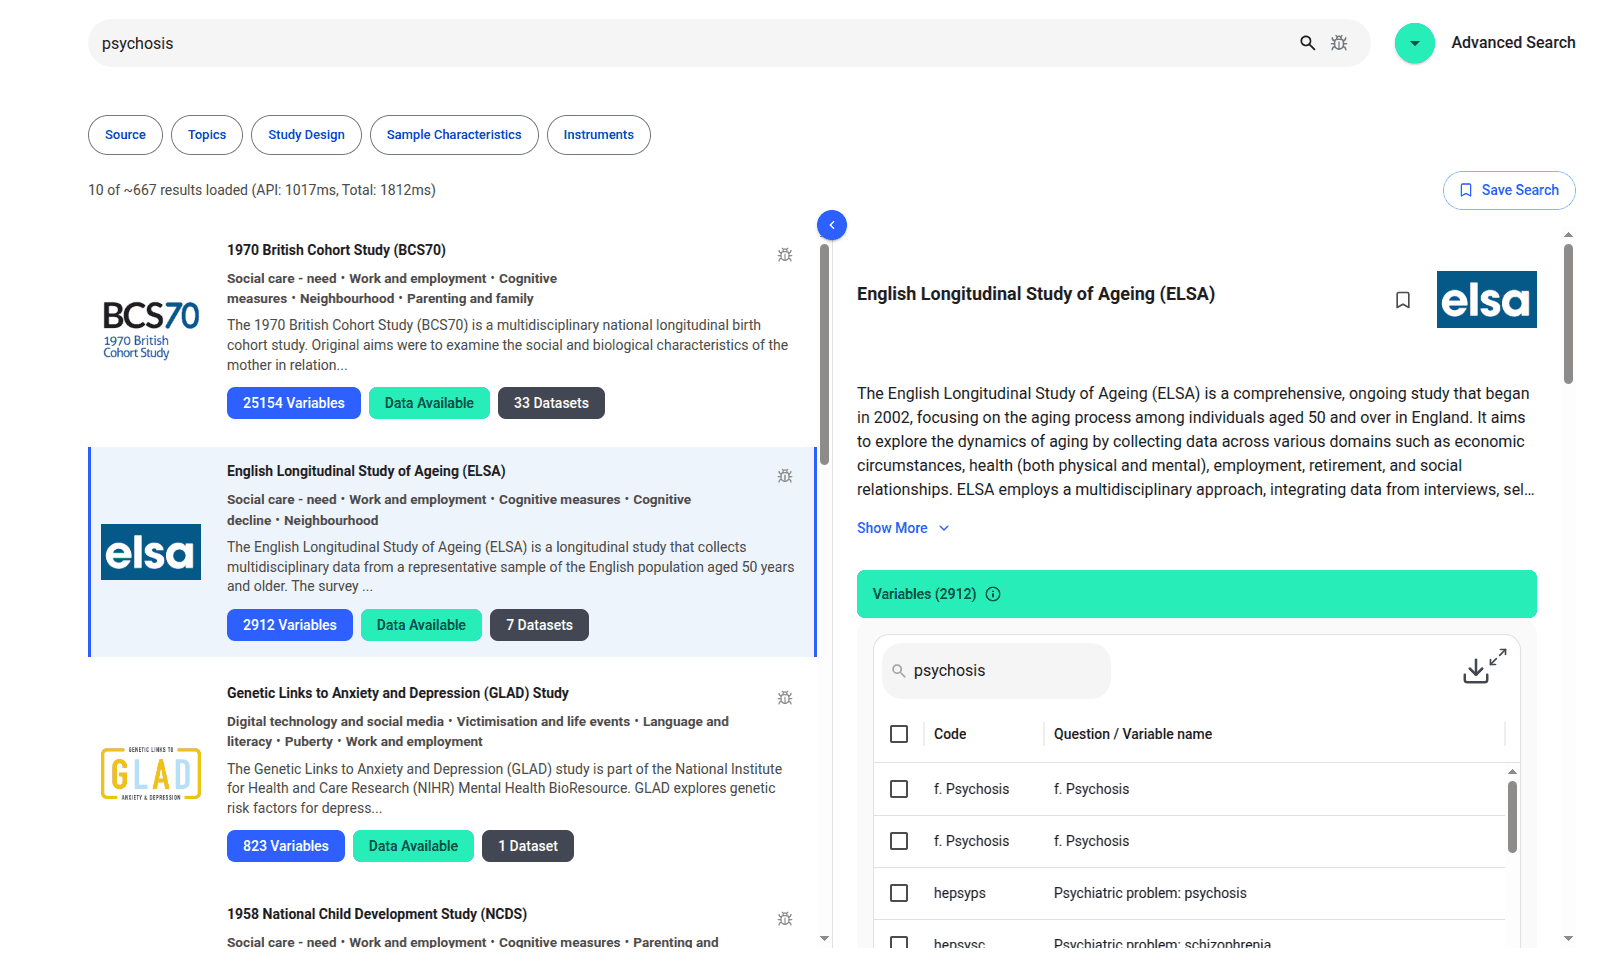
We are excited to introduce the new Harmony Meta platform, which we have developed over the past year. Harmony Meta connects many of the existing study catalogues and registers.

Guest post by Jay Dugad Artificial intelligence has become one of the most talked-about forces shaping modern healthcare. Machines detecting disease, systems predicting patient deterioration, and algorithms recommending personalised treatments all once sounded like science fiction but now sit inside hospitals, research labs, and GP practices across the world.
What we can do for you