You may have read my previous post about customer churn prediction. Another similar problem that’s just as important as predicting lost customers, is predicting customers’ daily expenditure.
Let me give you an example: you work for a large retailer which has a loyalty card scheme. You’d like to predict for a given customer how much they are likely to spend over the next week.
In this case normally there would be clear patterns
However there are a few problems when you get down to customer level:
What this means is that, if you look at all customers’ expenditures (or averaged over a region), you will probably see some recognisable weekly, monthly and seasonal patterns:
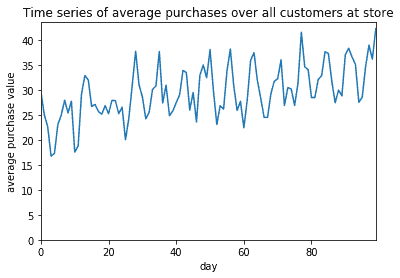
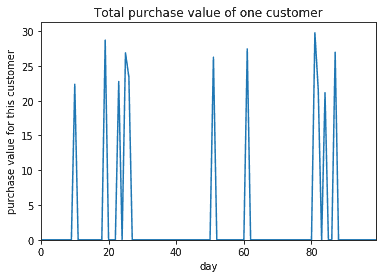
However for a single customer it’s hard to make out any recognisable pattern among all the noise. The weekly and yearly trends were only apparent when we averaged over all customers.
Fast Data Science - London
So how can you go about predicting the future expenditure of a given customer the next time they enter the shop?
This problem is quite interesting as there are at least two very different approaches to solving it, from two different traditional disciplines:
This means that depending on whether you hire somebody with a machine learning background, or somebody with a statistics background, you may get two contradictory answers.
In this post I’ll talk only about the predictive modelling approach.
If you are interested in predicting the first graph, which is averages for groups of customers, you might want to look into my next post on time series analysis.
The simplest way would be to use a predictive modelling machine learning approach. For example you could use Linear Regression. If you are unfamiliar with how to do this I recommend Andrew Ng’s Coursera course.
You would provide as input to your Regression model:
The output you want it to predict is:
This will predict the next purchase with some accuracy. After all the biggest factor to predict what someone will buy, is what they bought in the past.
However I’m sure you can easily think of some cases where this will break down. For example
You can improve the performance of the Predictive Model approach by making it a little more sophisticated:
If you have a prediction problem in retail, or would like to some help with another problem in data science, please contact me.
In practice it can be tricky to get the data on each customer that I described above. You need to extract certain statistics on customers’ past purchases from your database to train your model, and also query your database in real time to run a prediction. If you would like more ideas on how to do this please check out my video on the topic or this Python tutorial on Github, or read more about AI in business on our blog.
We recommend to use a recommender system. You will need a large number of transactions in your customer database, especially if there is a large (long-tailed) number of products.
Dive into the world of Natural Language Processing! Explore cutting-edge NLP roles that match your skills and passions.
Explore NLP Jobs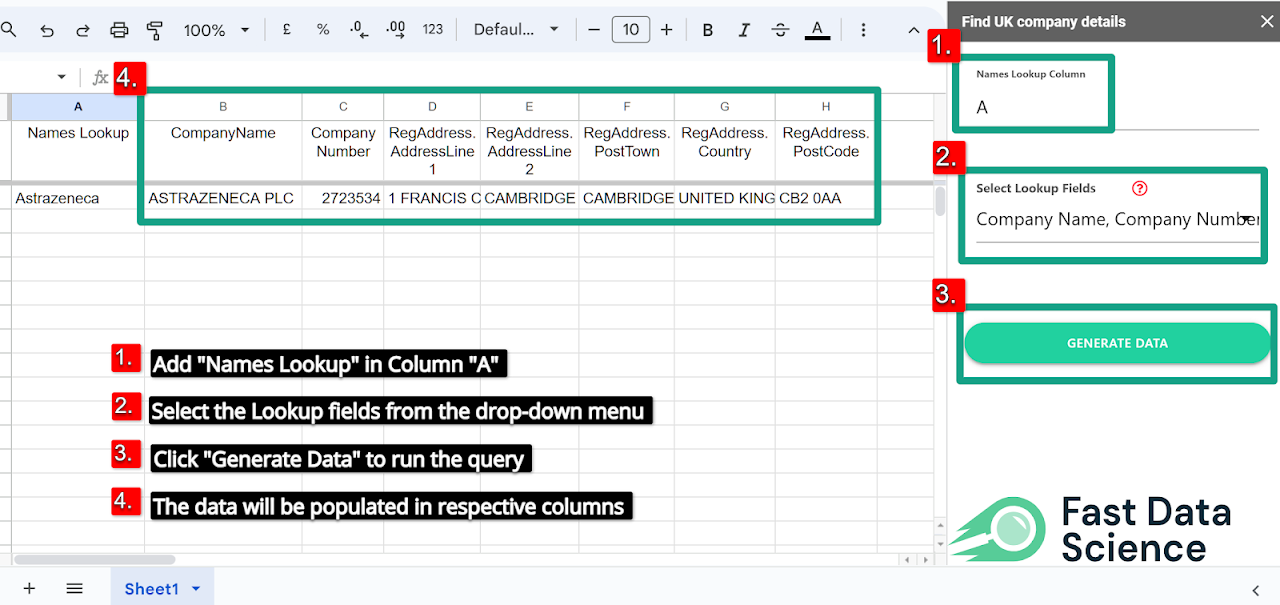
Fast Data Science are pleased to announce we have updated the UK Company Details Google Sheets™ plugin. The plugin allows you to retrieve details such as company number, incorporation date, address, and directors’ details from Companies House (the UK company registry) and automatically populate them in columns of a Google Sheets™ spreadsheet.

This is an article based on my presentation on “The Role of Artificial Intelligence in Expert Investigations and the Preparation of reports” which I gave at the Expert Witness Conference on 20 May 2026.

Many companies and organisations have large datasets that are stored in a very unstructured format. For example, you could work for a US based healthcare provider or insurer and have patient records stored in a free text format such as HL7 files or PDFs. A building regulator, land registry, or mortgage provider may have texts and accompanying diagrams from thousands of building inspections or land title deeds. A patent attorney’s office may have records of patent applications in PDF format.
What we can do for you