
Customer churn is when you have a number of customers in your company and a certain number of them are likely to end their relationship with your company in the near future. Customer churn can be harmful to a business because of the lost revenue and the wasted money on acquiring that customer, as well as the fact that a churned customer may have switched to a competitor, may be dissatisfied, and might leave negative reviews.
Customer churn may also indicate bigger problems. Happy customers rarely leave, and a high churn rate could indicate a problem with your business’s offering. So if you are seeing a sudden increase in churn, it’s probably worth looking into the cause - has anything else changed recently (pricing? delivery times? customer satisfaction indicators? broader industry or macroeconomic shifts?).
Even though we can’t say for sure what a customer will do, it’s possible to use machine learning and AI to anticipate roughly which customers are more or less likely to churn. Predicting customer churn can be challenging, whether you have small or large numbers of customers. But the value of accurately predicting churn can be huge.
You do not need to use a large language model or generative AI to develop a customer churn model. Simple linear machine learning models, or random forest and gradient boosted trees, are usually enough. A customer churn prediction project usually doesn’t need any natural language processing for a customer churn project, because most data is stored in numeric fields in a CRM or billing system, such as transaction amounts. It’s not unheard of for some unstructured text data to be present in a customer dataset, but for the purposes of churn prediction, you will usually find all you need in numerical tables.
The process of predicting customer churn with machine learning would involve building a database of snapshots of customer data from your CRM from fixed points in time. Each snapshot is an active customer at a particular date. You can then train a machine learning model, where the independent variables are the data points you had on that customer at the snapshot date, and the dependent variable is the final outcome (churn vs no-churn).
We've recently taken on a number of customer churn prediction engagements for clients in retail, aerospace technology and other fields, and I’d like to distill what we’ve learnt from these in this article. I’d like to aim this article at business owners and managers in large B2C companies, as too many tutorials on this topic are aimed at beginners in data science and focus only on logistic regression, but have little practical advice around how to a customer churn model in a real business scenario.Fast Data Science - London
Generally, machine learning becomes valuable for customer churn when you have very large numbers of customers, typically in a B2C context. If you have two or three customers each year, the numbers will be far too small for any meaningful pattern to show up. But thousands of customers are enough for there to be patterns that you can spot.
Useful resources
I’ve included some steps in a Python code repository so that you can follow along and try out the ideas I describe in this article: https://github.com/fastdatascience/customer_churn/blob/main/04_train_churn_model.ipynb
A customer churn project could be described as a lot of work joining tables, a little bit of easy work training machine learning models, and then a lot of hard work deploying your model to production.

Before getting started making an AI model to predict customer churn, we should first define the exact problem we want to predict either today or an arbitrary time in the future. We want to know something like:
which customers in the database are likely to cancel their subscription in the next month, given the information that we have about their ongoing subscription or relationship with our company and actions they have done in the past, but using no knowledge of actions that they will undertake in the future.
You can see that I have defined churn as “cancelling their subscription” in this case. This should be whatever easy-to-measure event that shows up in the data, which is closest as possible to what the company cares about: revenue. So your churn event could also be:
The important thing is that it should apply to all customers that we are analysing. If you have a mobile app, the frequency and nature of an event like “failure to renew” may vary between Play Store and Apple Store because of how subscriptions on those platforms work, so that may not be an adequate event to measure.
You need to also clearly define the time window in which that event occurs. In my accompanying example notebook on Github, I am using a 30-day lookahead to see if the account will be closed within 30 days of any date of interest. I’m also using a 30-day look behind to sum all transactions before that date of interest, which is an input feature into my model.
You’ll notice that I mentioned “given the information that we already have”. This may seem obvious but it’s important to formalise what knowledge we already have about a customer, because when we train our machine learning model, we will use knowledge of what was known at points in the past. It’s important to draw a clear distinction between the past and the future.
For example, the user’s home city in the database may not be a good feature to put into any machine learning model, because the user may have updated their address and the address now is not the one that was in the database a year ago. Likewise, if we want to use the “total spend by user” as a feature, we need to be able to reconstruct what the “total spend” was at a given date in the past - it’s no use if you only know the total spend now.
The training data will consist of a lot of “readings” of the state of a customer at various time points in the past, and events that happened before those time points - and one event that happens after, namely the churn event (a binary variable).

In an ideal case, you will have two or more years of data to train your customer churn model on.
If you are running your model at the beginning of 2026, I would suggest using all of 2024 as training data and all of 2025 as test data. A complete year of data encompasses all seasonal patterns in your industry. If the model trained on 2024 can reliably predict what will happen in 2025, then it’s likely to remain robust for predictions going forward.
You also want to define the time frame on which you will predict the customer churn. For example, do you want to predict if a customer will churn in the next week, month or year? This is a choice that you can make according to what time frames are important for your business. In general, you will achieve a higher accuracy and better performance metrics if you predict in the short term, such as a week. But you may have more data to work with if you train models to predict in the long term like a year.
Rather than using accuracy, I would use the area under the ROC curve (AUC). The AUC is a very useful metric for binary classification, and our churn is a binary outcome. It’s far more useful than using accuracy because in the real world, only 5% of your customers may churn in the relevant time period, so a model which predicts “retention” as an outcome 100% of the time would achieve a 95% accuracy, which would sound good even though it would be completely useless.
The ROC (Receiver Operating Curve) is a plot of true positive rate against false positive rate for a range of sensitivity thresholds in the model. A completely random model (roll of the dice) would achieve a 50% AUC, a model which gets everything perfectly wrong would achieve a 0% AUC, and a perfect model would achieve 100%.
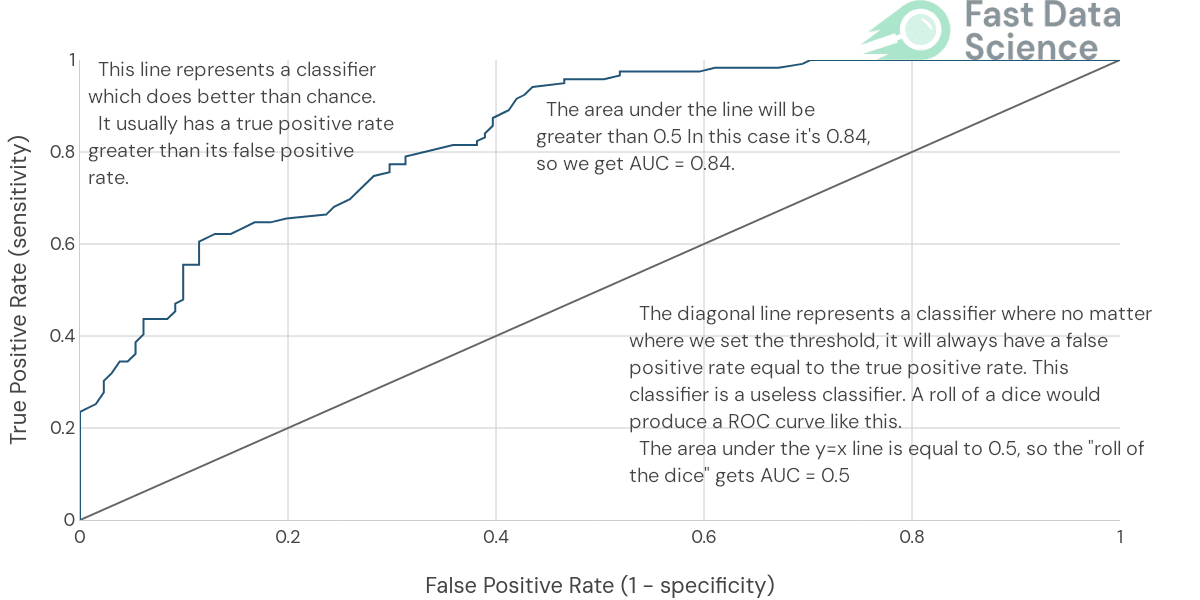
In a customer churn project in a business setting, I would consider that 70%-80% would be a good result and quite possibly a ceiling of what’s achievable. Remember, we are predicting the action that a person will take in the future, humans are inherently unpredictable, so in some senses it’s amazing that we can predict anything at all!
I would assume that you have a database table of customers containing key information such as demographic size and address, subscription type, payment type, and so on. This is your core database table that you will use for joining to other tables. Usually a large amount of relevant data can be obtained by joining your customer table to tables of transactions, or other interactions with a customer.
For example, every purchase may be recorded in a transactions table, and every interaction on the website may be recorded in a web analytics table. Let’s assume that in our case you have a customer table, a transactions table, and a web analytics table. For each customer, at any point in time, you can calculate things like the total spend until that date, the number of transactions in the past week, the number of website visits in the last week, and so on.
Your machine learning model needs an input table of the form below, where the x_i are the features that you know about a particular customer at a particular point in time (your independent variables) and the y is the churn (your dependent variable).
| x_1 | x_2 | x_3 | … | y (did the user churn in the next month) |
|---|---|---|---|---|
| 12 | 21 | 64 | … | 0 |
| 2 | 5 | 2 | … | 1 |
| … | … | … | … | … |
This has to be a flat table. So before you go anywhere near machine learning, you need to spend some time gathering data about the “state of your knowledge about a customer” at a time in the past, and condensing it into a single table.
If you have 100 customers, and 10 time points, you will then have 100 * 10 = 1000 rows in your joined table.
| date that we are looking at | customer ID | transactions in last week | total spend to date | website visits in last month | … | y (did the user churn) |
|---|---|---|---|---|---|---|
| 2 January | 4674 | 12 | 21 | 64 | … | 0 |
| 3 January | 6873 | 2 | 5 | 2 | … | 1 |
| … | … | … | … | … | … | … |
Joining and building this table correctly is 90% of the work involved in building the initial churn model (excluding deployment of the model, which is its own massive headache and which will come later!).
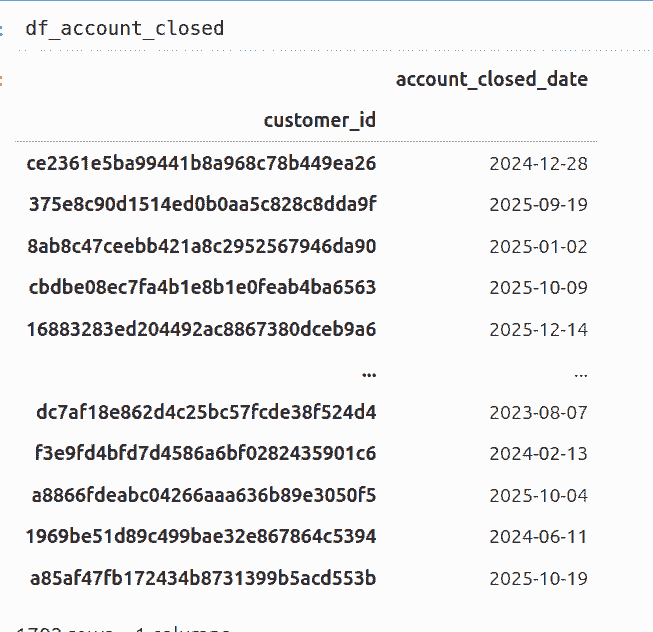
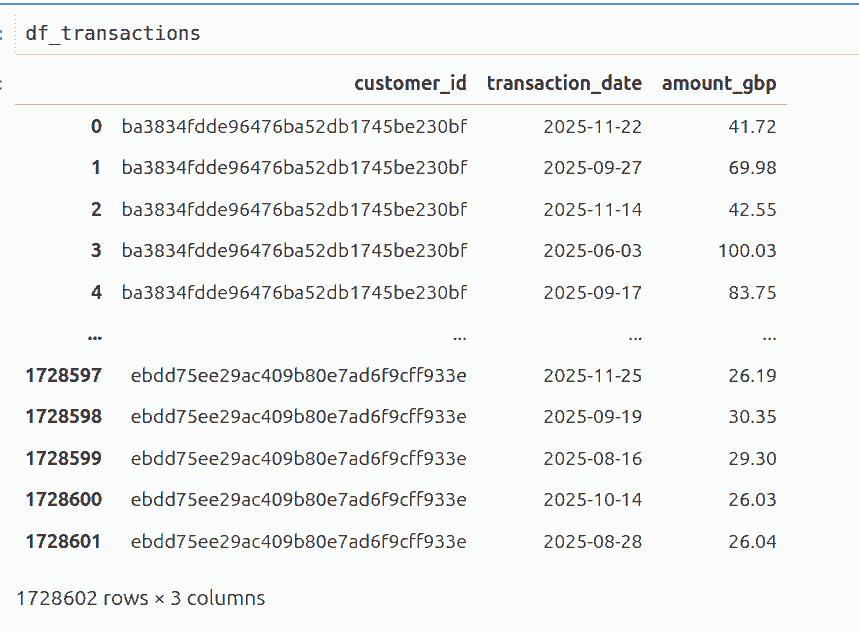
In my walkthrough example on Github, we have a customers table, a transactions table, and a table for accounts closing.
They look like the tables below before joining. In the walkthrough, we will join them using Pandas, but in practice you would try to join them on your database using SQL Join commands of some kind, if possible.
It’s sometimes the case that the data is split across systems, for example, a web analytics system, Salesforce, and a finance system. In those cases you will definitely need to harmonise and join the data yourself, and the data cleaning will be hard work.

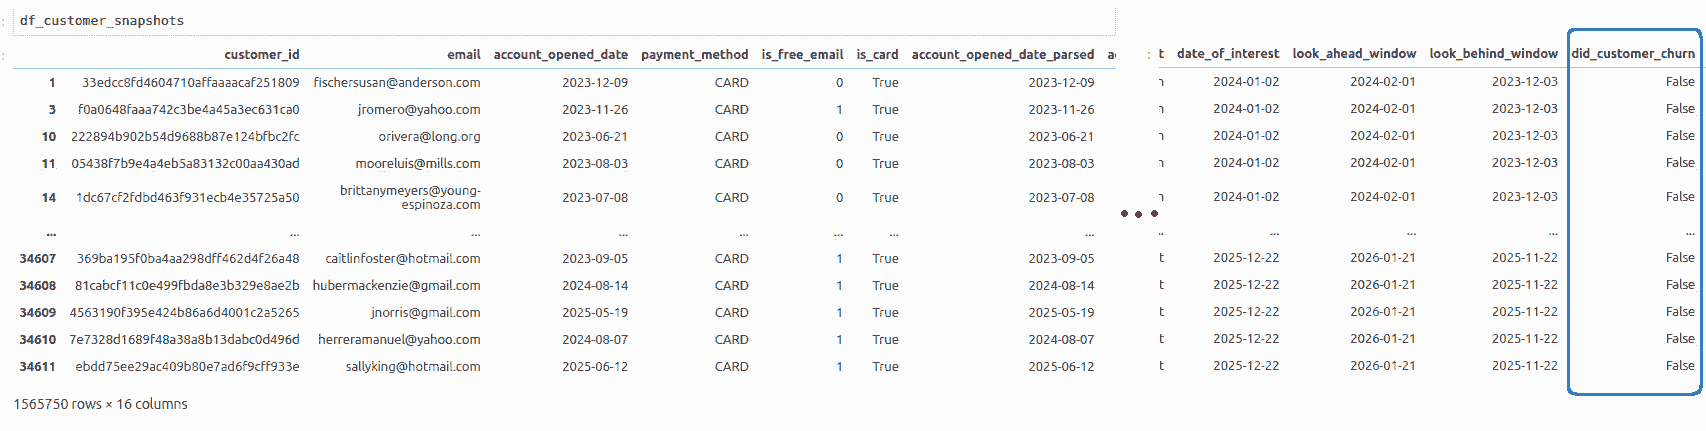
After joining, we get a very wide and very long table, where every row corresponds to an active customer at a particular date of interest in the past, and contains our outcome did_customer_churn (whether the customer churned within 30 days of the date of interest). Doing this join can take a long time, and if the resultant table is too big for your computer to handle, you may want to sample it.
In every customer churn project I have worked on, the highest performing algorithm has been either a random forest model or XGBoost model.
These models are useful because they are very good at handling data with weird distributions, they can learn patterns involving complex interactions between features, and you don’t need to put in too much work cleaning up your features.
For example, it’s quite possible that you have 100 customers who spent around £10 and one single customer who spent £10,000. If you were to use a linear regression model, effects from that one giant customer will dominate the behaviour of the entire model, and you’ll end up with an inadequate model that performs badly on the £10 and the £10,000 customers. With a random forest model, you don’t have this concern.
For the purposes of this discussion we don’t need to understand exactly how a random forest model works, but suffice to say that the model contains a huge number of smaller models with their own parameters, can be very large and slow, but can handle more complex relationships between variables than simple correlations.
Now that you have joined your data, you can do a train-test split. Traditionally in machine learning you may have heard about using a randomised 80-20 split over all your data points. However at this point I would suggest to split your data over time, so your model is trained on data seen before 1 January 2025, and tested on data afterwards.
Why should we split the data over time instead of using randomisation over a consistent time period? Won’t our model be susceptible to changes in market conditions, seasonality, and macroeconomic factors?
Answer: Randomised splits tend to give over-estimates of the model performance. It’s hard to prevent leakage of data between your training and test sets. So you need to be certain that no customer ever affects both your train and test sets. Also, the testing process should be as close as possible to the real world scenario that we want to run the model in. In the real world we have a clear cutoff between the past and the future. If we can show that our model was robust against macroeconomic trends from 2024 to 2025, we hope that the same approach will allow us to keep predicting into 2026 and beyond.
I would then train a random forest model on the training dataset, and use it to predict the churn on the test dataset. I would take the probability prediction from the model, and plot a ROC curve and measure the Area Under the Curve (AUC).
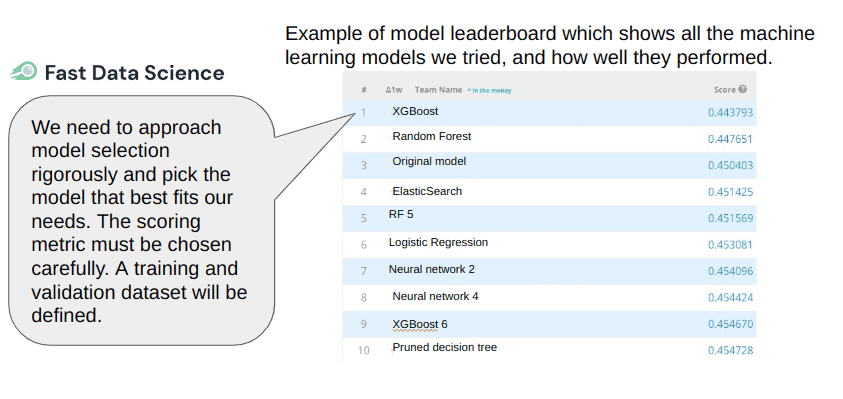
I would also try this with and without the analytics tables, adding and removing features, and keeping track of the effect on the AUC. I would usually train an iterative series of models, starting from the simplest, and each time adding more and more useful data, but always evaluating performance on the same test set. I number these experiments expt_01, etc, and often go through around 40 or 50 models, recording scores in a leaderboard, before choosing a winner.
You will see over time that the AUC will gradually improve until it hits a ceiling and stops going up, even when you add more features. Hopefully you will have achieved an AUC of somewhere around 70% or 80%.
Once you have trained and tested your model, I recommend looking inside it. A random forest model will provide “feature importances” which let you see which features have been the most informative. This will be useful as it may help you understand the mechanisms behind the churn. For example, maybe a customer submitted a complaint or raised a ticket with support, and that feature is the #1 predictor of churn.

I suggest also to plot some graphs showing the breakdown of different variables and things like the overall probability of churn given that the user paid with card vs other payment methods. This is really informative, and graphs help you uncover all kinds of patterns that you would otherwise miss. For example, for one customer, it was clear that users who pay with Apple Pay are unlikely to renew their subscription - the reason is that Apple Pay doesn’t allow apps to auto-renew paid subscriptions without user interaction, so renewal rates will naturally be lower on Apple Pay than via other payment platforms.
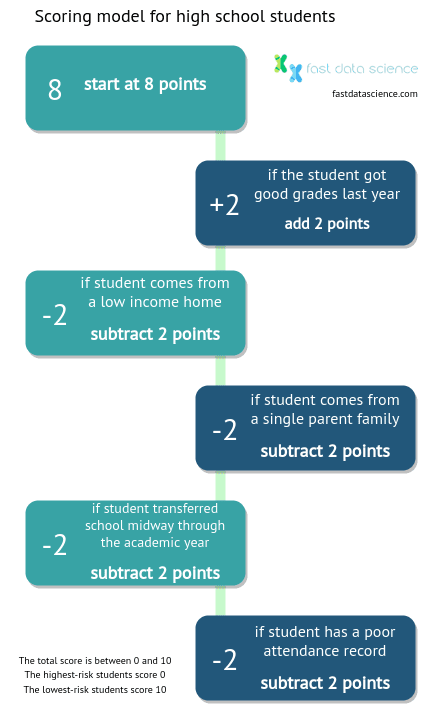
I am a big fan of also going back to basics and making a human-readable scoring model which can be used by a human even with pen and paper to quickly score a customer.
Knowing what you know from the random forest model about the informative features, you can pick the best features, probably engineer them a little (for example, if there is one customer who spent £10,000, you can create a feature for total spend capped at £100, so that outliers don’t disrupt your model too much), and put them into a Logistic Regression model.
You can then take the coefficients from the logistic regression model and normalise them to a scale of 100. Then you can create a recipe for scoring a customer like
1.20
+ num_transactions_in_last_30_days_capped_at_10 * 13.51
+ spend_in_last_30_days_capped_at_100 * -1.20
+ is_free_email * 55.87
+ is_card * 29.11
+ days_since_last_transaction_capped_at_30 * 0.31
This makes a score whose maximum is 100 (very likely to remain) and minimum is 0 (very likely to churn). Something like this is great for gaining a intuitive understanding of what is driving churn.
You should also calculate your AUC for the linear model. I would expect it to be better than chance (i.e. over 50%) but not perform as well as the random forest model.
Now that you’ve trained on 2024 and evaluated on 2025, I would suggest to make a new final production model trained on both 2024 and 2025, which can be used for future predictions. This is a little harder to evaluate but you could hold out a tiny bit of 2025 data to evaluate it. The reason is that you are now using all of your data to make the final predictive model.
After training the final predictive model, you need to make some predictions on the current customer database.
You will probably need to write some SQL queries to get the state of all customers at the current moment in time. This will be very similar to the queries used to gather your training and test data, but adjusted slightly because we’re interested in the current state of those customers rather than reconstructing known information at a particular date in the past.
You can then create a table of predictions looking something like this:
| customer id | probability of churn |
|---|---|
| 129875 | 0.92 |
| 687216 | 0.91 |
| … | … |
If you sort the customers by probability of churn, you can quickly identify those customers that you need to focus a retention effort on.
Now that you’ve identified the customers who are likely to churn, what can we do about it?
Predicting the probability of churn doesn’t tell us anything about causality (in fact causality is a very difficult thing to model accurately). But I would suggest trying a few interventions on the customers that we know are likely to churn, to see if there’s anything we can do to influence them.
For example, we can take the 1000 most likely to churn customers and split them randomly into two groups of 500 people each, which we will call “control” and “treatment”. We can send the 500 people in the treatment group a voucher offering a 50% discount, and the 500 control group receive nothing. This approach is called an A/B test (you can read more in our article on A/B testing).
If the group was on average 90% likely to churn, we would expect 450 people in the control group to churn in our time period. If the voucher causes the churn rate to drop to 80% in the treatment group, we would have retained 50 extra customers, and the extra retention would have just covered the money lost by offering the 50% discount.
Before running an A/B test like this, take a while to sit down and think about how many customers you might expect to retain with the voucher, and use an A/B test calculator to estimate the sample size that you’d need in order to get any useful information out of the experiment.
If the A/B test is effective, you could consider rolling out the discount strategy across all customers as a regular business process. Now we’re talking about model deployment.
In addition to running the A/B test, you can also learn from the random forest model’s feature importances. For example, if churns are highly correlated with complaints, you would want to look into what those complaints are telling you. Maybe there is a particular product line that leaves customers very dissatisfied. There will be a wealth of business insights that you can gather from the churn model and use to guide a customer retention strategy. Perhaps, instead of the A/B test, you could call up the customers who are likely to churn and try understand if their needs are not being met.
In my experience, deploying a model is at least as much work as all the model development and data engineering work that we’ve done up to this point.
You will need to write and deploy batch jobs to pull out your features from the company database on a regular basis, run the model, and take whatever action is needed from the model’s predictions, all without human intervention.
There are a huge number of things which can go wrong here, so you’ll need to set up monitoring to check that the model is still running without errors, check that it’s not emailing too many people, and of course, keep monitoring how many people redeem the voucher.
Deployment will need coordination between your data science and engineering teams, as well as some outlay for hosting infrastructure.
You may also want to set up a regular job to re-train your model as more data comes in, although I would generally prefer only to train models manually, as any unsupervised training process has far too many things that can go wrong.
Predicting customer churn is not difficult, but the lion’s share of the work involves gathering data from different tables and joining it together. My recommendation is to approach customer churn as a binary prediction problem and build a random forest model. You may have to think carefully about your definition of “churn” if there is not a single clear cut churn event that you can use, such as a user cancelling their subscription.
I also recommend using a temporal split (training on the past to predict the future), rather than the random split into training and test data that we usually use in machine learning.
If you would like to learn more about customer churn, or have a customer churn problem in your business, please get in touch with me.
You may also be interested in my earlier post and videos on predicting customer spend and predicting employee churn.
The choice of time period should be whatever is most relevant for the company. Ask yourself, if you were the CEO, is it better to know who will churn in the next year, or the next month? You can always predict both. A time period that is too short will make it hard to train a machine learning model because of data sparsity.
For example, if you have 10,000 customers and only 4 churners, that is too little data to learn any meaningful patterns, so you should choose a time period where a significant proportion of customers churn anyway.
In general your endpoint that you are trying to predict, is “will customer #12312 be active on [date]”. If they leave and re-enter it doesn’t matter, the main thing is will they be still an active paying customer on the date that you care about.
Your prediction will always be a probabilistic prediction, e.g. you give customer #12312 a 89% churn score. You can never be completely sure if that cusomter will churn or not. We are predicting a customer’s most likely action (churn vs retain), not their mindset. We cannot see inside their mind.
If your business is not a subscription business, you will need to use a definition of churn that is applicable to your case. For example, if you have a bakery and people buy every day, but then someone doesn’t buy for a month, you could consider that person to have churned. You will have to choose a time window that is appropriate for the business as your definition of churn.
A lot of the time you will find in a customer churn project that there is only quiet churn, rather than an official churn event that occurs at a well defined point in time. Only in a subscription based business would you see users actively doing something that constitutes a churn event, such as cancelling their Amazon Prime subscription. But even with a subscription model, a user will churn if they don’t put a valid card on the account when the current card expires, so there are still churn events that aren’t marked by a subscription cancellation. If you work a subscription based business which charges annually, and 6 months into a term a user stops logging in, you could consider the churn event to be at that point, rather than at the first point in time 6 months later that the user declines to renew.
However, cancellations and non-renewals are the easiest things to measure, so you might be better off working with those if they are available in your context.
On one project that we worked on, I built a machine learning model to predict whether a student at a higher education college will stop coming to classes. We have data on each student such as whether they come from a single parent family, their household income, and their past grades, and their home address. Looking at thousands of students, you can see the patterns. Students who have poor grades and a low income background tend to be more likely to quit.
But when a student stops coming to class, they don’t tell the teacher or school. They just stop turning up (we could call this “quiet quitting”). If the student doesn’t show for a week and they haven’t informed anyone they are sick, we consider them to have quit. Students won’t officially un-enrol from classes (unless a payment is due). So churn in an educational institution is something that you will have to define.
We can contrast the student churn example with predicting employee churn. We worked on a project to predict employee turnover in the NHS. You would expect that for predicting employee churn, you will have a “churn event” which is the point that the person ceased to be an employee of a company. However in this context, we had to define churn as “absence from the payroll for more than 6 months”, because of the way the dataset was structured.
Any kind of business which relies on repeat or regular customers will want to improve customer retention and reduce churn.
If you are a business which makes one-off sales (imagine an ice cream vendor in a tourist hotspot) then it may be less relevant. Also, some businesses may only make a small number of sales each year. If you are a consulting business which gets a government contract every year and applies via a procurement portal, and your local government is your only customer, then churn isn’t really applicable to you - the data would be far too sparse to train a churn model.
In general, I would say for a b2c business (a business which sells to private individuals), churn would nearly always be applicable. For a b2b business, churn would sometimes be applicable.
Subscription businesses will predict churn by training a model in the way I described in this blog post and in this example code on Github: take all customers at time t, and track them until time t+δt. If 90% are still active at time t+δt, then train a model to classify between these two classes (ACTIVE vs INACTIVE), based only on the information which was available at time t. This task is much simpler for subscription based businesses than non-subscription based businesses.
Any competent data science consultancy, such as Fast Data Science, should be able to gather, clean and join the customer data from your CRM and other systems, train and evaluate a machine learning model to predict churn, and deploy it as an API. If your CRM is off-the-shelf, there should be a way to integrate it with other systems. For example, maybe the churn model can mark probable churners with a high priority flag if they are likely to cancel a subscription in the next week. The churn model could run as a batch job, e.g. every night, or with whatever frequency your business requires. In order to ensure that the churn model meets privacy rules, we would make sure that no sensitive data gets into the training data, or code repositories, and ensure that the deployment is on a secure connection. There are steps we can make to ensure HIPAA and GDPR compliance and we can even anonymise data or work with synthetic data if the data involved is very sensitive.
A customer churn model can also be built using unstructured text data as the input (independent variable). In this case, for each customer, you have the following information:
Using sentence embeddings or even Naive Bayes models, you can convert the email texts into a more manageable form.
You can then train a machine learning model on the email text and other data, such that, if a new support email is received, you can calculate the probability of that customer churning within your time frame of interest.
A data science consultancy like Fast Data Science should be able to handle the end-to-end model development (training and evaluation) as well as deployment to an API, and integration into your CRM system. There may also be a manual data cleaning stage. Fast Data Science can set up a monitoring system such as Nagios to ensure that alerts are sent if there is any problem with the churn model in future.
You cannot predict for certain which customers will churn a fixed number of days before their renewal date, but you can make a good guess by training a machine learning model to predict customer churn.
To achieve this, first you should assemble a dataset of all your past customers at a snapshot in time 90 days before their planned renewal date. Every customer+renewal date pair should appear once in this dataset. So if you had a particular customer for 5 complete years, this customer should be entered 5 times into your dataset, once for each renewal date. Each customer+renewal pair comes with a single binary dependent variable: “renewed” or “didn’t renew”. The independent variables are all the metadata you had on each customer’s subscription at that moment in time. Make sure to exclude any information that became known after the renewal date.
Then, separate out your dataset into a training set and a validation set by chopping it at a point in time, and follow the steps in this tutorial to train a machine learning churn model to predict churn with a 90-day window.
Note that it’s only of secondary importance whether the user actively cancelled a subscription, or simply didn’t renew it, or let their card expire. The main independent variable which you are predicting is “renewed” vs “didn’t renew” - since that is more directly related to your business’s turnover or profit. The mechanism of churn can be examined later, once you’ve built the initial churn model, as that may influence retention initiatives. For example, if a user churned because their card has expired, you can send reminders to all users with card expiry dates in the past, to update their card, perhaps 30 days before renewal. I would recommend to A/B test all of these interventions.
Yes, it is possible to train a machine learning model to predict which customer will take which particular action, such as upgrading, renewing, churning, or cancelling a subscription. Even though we can’t see inside an individual customer’s mind and anticipate their actions, if you have enough data then you can train a machine learning model to look for patterns in your CRM data. This is assuming that you have enough customers (>100 or so) to train and validate a churn model. If you have a small b2b business with only one or two customers per year, then a machine learning churn model won’t really be applicable in your case.
It is possible to predict the likely outcome of an individual customer, if you have enough customers in your CRM. Either there is an active step that the customers are taking to cancel their subscription, or customers are letting their subscriptions lapse. In either case, there should be patterns and signals that are visible in customers’ behaviour before the churn event takes place. Please follow the steps in the tutorial to train a machine learning churn model.
Abandoned baskets are a common problem for e-commerce businesses, and the frustrating thing is that you may not know why a customer abandoned their shop before checkout.
I would start with an analysis of your sales funnel. There are usually a number of steps, from landing page, to product selection, delivery options, and finally when the customer submits their payment information. Customers could be dropping off the sales funnel at any point in this process. The easiest way to visualise the drop-out would be to make a Sankey diagram:

Once you have identified where customers are churning in your sales process, then you can choose the point in time where it’s most advantageous to your business to predict the churn. For example, is it at the moment that the first item has been added to the basket? The ideal moment will be a combination of what is practical according to the data being collected, and what will actually be useful for the business, both in terms of understanding root causes of churn and in terms of intervening to stop it.
You can then gather a dataset of customer+basket snapshots, where each data point is a customer at the critical point in the purchase process. You can split it by time and join your tables so that you have a simple denormalised table for training and validating your machine learning model. Then you can follow the steps in the tutorial to train a machine learning churn model to predict churn at checkout.
It is quite normal for a customer churn dataset to have a strong class imbalance. For a healthy business, customer retention should be the norm. It is quite likely that if you are working on a timeframe of 1 month, only 1% or fewer of customers tend to churn within that time window.
I would recommend to use a machine learning model, such as Random Forest, Naive Bayes, or Logistic Regression, which is robust to class imbalances. Make sure that you are using the “probability” output of the model, not the predicted labels, otherwise your model will predict that all customers will be retained (since that’s the most likely outcome even for the customers who are relatively likely to churn). Because the baseline churn rate is so low, all individual customers are expected not to churn, but paradoxically, we do still expect a low background churn rate.
When the model outputs the predictions, you can just sort your customers by churn likelihood. Some customers will have a 5% probability of churn, some will have a 4% probability, and so on. Nobody will have a probability above 50%. So you should target any interventions, such as coupons or vouchers, to the 5% customers, if they are the ones with the highest churn probability.
If you are finding that the class imbalance is still disrupting your models (for example, you have found too few churners, and so there is a data sparsity problem which is affecting model performance), then you have two options:
I recommend you to identify where the churn is occurring, and train a machine learning model to predict churn at the appropriate moment in time. You can then deploy your churn model to an API and connect it to your mobile app, allowing you to send push notifications to the user at an opportune moment if your model identifies them as likely to churn soon. You should A/B test your retention intervention to ensure that it’s effective and has a suitable ROI. A 50% off voucher may reduce churn, but if the business loses money then it’s still not a worthwhile intervention.
Each of the pieces of information that you know about the customer, such as tenure, contract type, etc, can be entered into a machine learning model as an independent variable. Your dependent variable would be the “churn” vs “not churn” status. You can make a table of data where each row is a customer at a snapshot in time, with those snippets of information about them. Just be careful to only use the tenure at the time of the snapshot, not at the current time. Then you can follow the steps to train a customer churn model. You can use this example notebook: https://github.com/fastdatascience/customer_churn/blob/main/04_train_churn_model.ipynb
You would need to deploy your model as an API. This typically involves a cloud provider such as AWS, Microsoft Azure, or Google, but you may be able to host it in your company. You probably want to secure the deployment and ensure that nobody outside your company can access it. You should check it also for any AI governance issues such as bias. You can talk to Fast Data Science and we can help you to deploy the churn model and also stress-test it.
I do not recommend to tackle customer churn by simply feeding your data into a generative AI model such as Gemini or ChatGPT. There are many reasons why this is a bad idea:
By all means, you can prompt the LLM to create some Python code to analyse your database. I think this is definitely a worthwhile use of LLMs. However, most of the work in a churn project is in joining, cleaning, understanding, and denormalising your data. I would be worried about entrusting this to an LLM, because it’s a project that involves a lot of back and forth with your business stakeholders and trying to understand the customer journey. The LLM might miss something important.
Ready to take the next step in your NLP journey? Connect with top employers seeking talent in natural language processing. Discover your dream job!
Find Your Dream Job
Unlock your business potential with expert AI consulting services from Fast Data Science. Discover strategies to accelerate growth and outperform competitors.

Financial advisors, like lawyers, are regulated in the UK. All financial advisors should be registered with the Financial Conduct Authority (FCA) and must have certain qualifications and have signed up to a code of ethics. UK financial advisors must also complete professional training every year.
What we can do for you
