Large businesses like Amazon can swallow the cost of product returns, and generally account for it, but if you’re running a small business a single return can be very expensive. However, product returns can be a major problem for small and large businesses and it is helpful to identify when this is likely to occur.
We can’t say for sure whether a particular customer will initiate a product return, but it is possible to use machine learning and AI to identify which customers are most likely to initiate a return.
You don’t need to use a large language model or generative AI to make a product returns prediction model - in fact, I would argue that it’s overkill. Very simple machine learning models, perhaps linear models or random forest, should be enough. This is because most data that we will use is not in text form, but most probably in numerical fields in a database.
You can predict product returns in a very similar way to how I would predict customer churn: you can build a database of “snapshots” of what we knew about a customer and product at the moment that the customer made the purchase. So each snapshot is a purchase at a particular date and all that was known about that transaction. For example, the customer’s history, customer’s address, number of past returns, total spend to date, transaction value, product category, product ID.
You can then train a machine learning model, where the independent variables are the data points you had on that purchase at the snapshot date, and the dependent variable is the final outcome (return vs no return).
Fast Data Science - London
Generally, machine learning becomes valuable for product returns when you have very large numbers of customers, typically in a B2C context. If you have two or three customers each year, the numbers will be far too small for any meaningful pattern to show up. But thousands of customers are enough for there to be patterns that you can spot.
Useful resources
You will probably find this Python repository useful - it’s focused around customer churn but the same ideas apply for product returns: https://github.com/fastdatascience/customer_churn/blob/main/04_train_churn_model.ipynb
A product returns modelling project is a lot of work joining tables, a little bit of easy work training machine learning models, and then a lot of hard work deploying your model to production.
Before getting started making an AI model to predict product returns, we should first define the exact problem we want to predict either today or an arbitrary time in the future. We want to know something like:
which customers in the database are likely to request a return or refund in the next month, given the information that we have about their ongoing subscription or relationship with our company and actions they have done in the past, but using no knowledge of actions that they will undertake in the future.
You need to also clearly define the time window in which the product return event occurs. In my accompanying example notebook on Github, I am using a 30-day lookahead to see if the account will be closed within 30 days of any date of interest. I’m also using a 30-day look behind to sum all transactions before that date of interest, which is an input feature into my model.
No peeking into the future!
You’ll notice that I mentioned “given the information that we already have”. This may seem obvious but it’s important to formalise what knowledge we already have about a customer, because when we train our machine learning model, we will use knowledge of what was known at points in the past. It’s important to draw a clear distinction between the past and the future.
For example, the user’s home city in the database may not be a good feature to put into any machine learning model, because the user may have updated their address and the address now is not the one that was in the database a year ago. Likewise, if we want to use the “total spend by user to date” as a feature, we need to be able to reconstruct what the “total spend” was at a given date in the past - it’s no use if you only know the total spend now.
The training data will consist of a lot of “readings” of the state of a customer at various time points in the past, and events that happened before those time points - and one event that happens after, namely the product return event (a binary variable).
You can then train a model that, given this information for a new customer, will give an output like “this customer is 15% likely to request a product return”.
You also want to define the time frame on which you will predict the product return event. For example, do you want to predict if a customer will request a product return in the next week, month or year? This is a choice that you can make according to what time frames are important for your business. In general, you will achieve a higher accuracy and better performance metrics if you predict in the short term, such as a week. But you may have more data to work with if you train models to predict in the long term like a year.
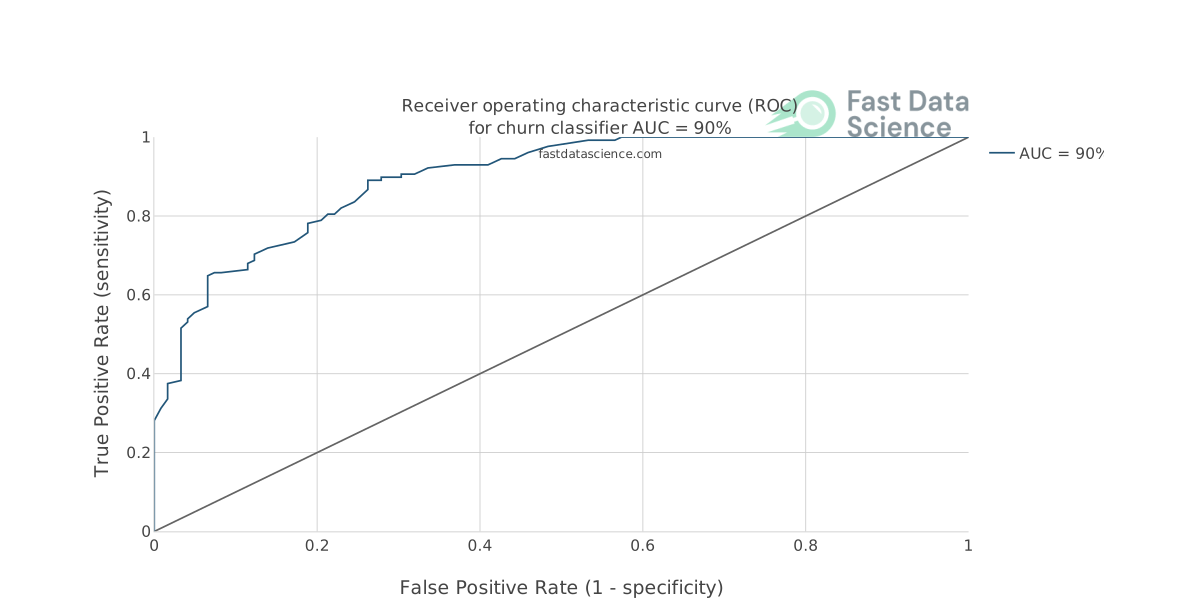
Rather than using accuracy, I would use the area under the ROC curve (AUC). The AUC is a very useful metric for binary classification, and a product return vs no return event is a binary outcome. It’s far more useful than using accuracy because in the real world, only 5% of your customers may request a product return in the relevant time period, so a model which predicts “retention” as an outcome 100% of the time would achieve a 95% accuracy, which would sound good even though it would be completely useless.
The ROC (Receiver Operating Curve) is a plot of true positive rate against false positive rate for a range of sensitivity thresholds in the model. A completely random model (roll of the dice) would achieve a 50% AUC, a model which gets everything perfectly wrong would achieve a 0% AUC, and a perfect model would achieve 100%.
I would assume that you have a database table of customers containing key information such as demographic size and address, subscription type, payment type, and so on. This is your core database table that you will use for joining to other tables. Usually a large amount of relevant data can be obtained by joining your customer table to tables of transactions, or other interactions with a customer.
For example, every purchase may be recorded in a transactions table, and every interaction on the website may be recorded in a web analytics table. Let’s assume that in our case you have a customer table, a transactions table, and a web analytics table. For each customer, at any point in time, you can calculate things like the total spend until that date, the number of transactions in the past week, the number of website visits in the last week, and so on.
Your machine learning model needs an input table of the form below, where the x_i are the features that you know about a particular customer at a particular point in time (your independent variables) and the y is the churn (your dependent variable).
| x_1 | x_2 | x_3 | … | y (did the customer request a product return in the next month) |
|---|---|---|---|---|
| 12 | 21 | 64 | … | 0 |
| 2 | 5 | 2 | … | 1 |
| … | … | … | … | … |
This has to be a flat table. So before you go anywhere near machine learning, you need to spend some time gathering data about the “state of your knowledge about a customer” at a time in the past, and condensing it into a single table.
If you have 100 customers, and 10 time points, you will then have 100 * 10 = 1000 rows in your joined table.
| date that we are looking at | customer ID | transactions in last week | total spend to date | website visits in last month | … | y (did the customer request a return) |
|---|---|---|---|---|---|---|
| 2 January | 4674 | 12 | 21 | 64 | … | 0 |
| 3 January | 6873 | 2 | 5 | 2 | … | 1 |
| … | … | … | … | … | … | … |
Joining and building this table correctly is 90% of the work involved in building the initial product returns model (excluding deployment of the model, which is its own massive headache and which will come later!).
In my walkthrough example on Github, we have a customers table, a transactions table, and a table for accounts closing.
They look like the tables below before joining. In the walkthrough, we will join them using Pandas, but in practice you would try to join them on your database using SQL Join commands of some kind, if possible.
In every product returns project I have worked on, the highest performing algorithm has been either a random forest model or XGBoost model.
These models are useful because they are very good at handling data with weird distributions, they can learn patterns involving complex interactions between features, and you don’t need to put in too much work cleaning up your features.
For example, it’s quite possible that you have 100 customers who spent around £10 and one single customer who spent £10,000. If you were to use a linear regression model, effects from that one giant customer will dominate the behaviour of the entire model, and you’ll end up with an inadequate model that performs badly on the £10 and the £10,000 customers. With a random forest model, you don’t have this concern.
For the purposes of this discussion we don’t need to understand exactly how a random forest model works, but suffice to say that the model contains a huge number of smaller models with their own parameters, can be very large and slow, but can handle more complex relationships between variables than simple correlations.
Now that you have joined your data, you can do a train-test split. Traditionally in machine learning you may have heard about using a randomised 80-20 split over all your data points. However at this point I would suggest to split your data over time, so your model is trained on data seen before 1 January 2025, and tested on data afterwards.
Now that you’ve trained on 2024 and evaluated on 2025, I would suggest to make a new final production model trained on both 2024 and 2025, which can be used for future predictions. This is a little harder to evaluate but you could hold out a tiny bit of 2025 data to evaluate it. The reason is that you are now using all of your data to make the final predictive model.
After training the final predictive model, you need to make some predictions on the current customer database.
You will probably need to write some SQL queries to get the state of a customer at a moment in time that a purchase was made. This will be very similar to the queries used to gather your training and test data, but adjusted slightly because we’re interested in the current state of those customers rather than reconstructing known information at a particular date in the past.
You can then create a table of predictions looking something like this:
| customer id | probability of product return |
|---|---|
| 129875 | 0.92 |
| 687216 | 0.91 |
| … | … |
If you sort the customers by probability of product return, you can quickly identify those customers that you need to focus a retention effort on. Or perhaps identify certain products that are underperforming or frequently returned.
Dive into the world of Natural Language Processing! Explore cutting-edge NLP roles that match your skills and passions.
Explore NLP Jobs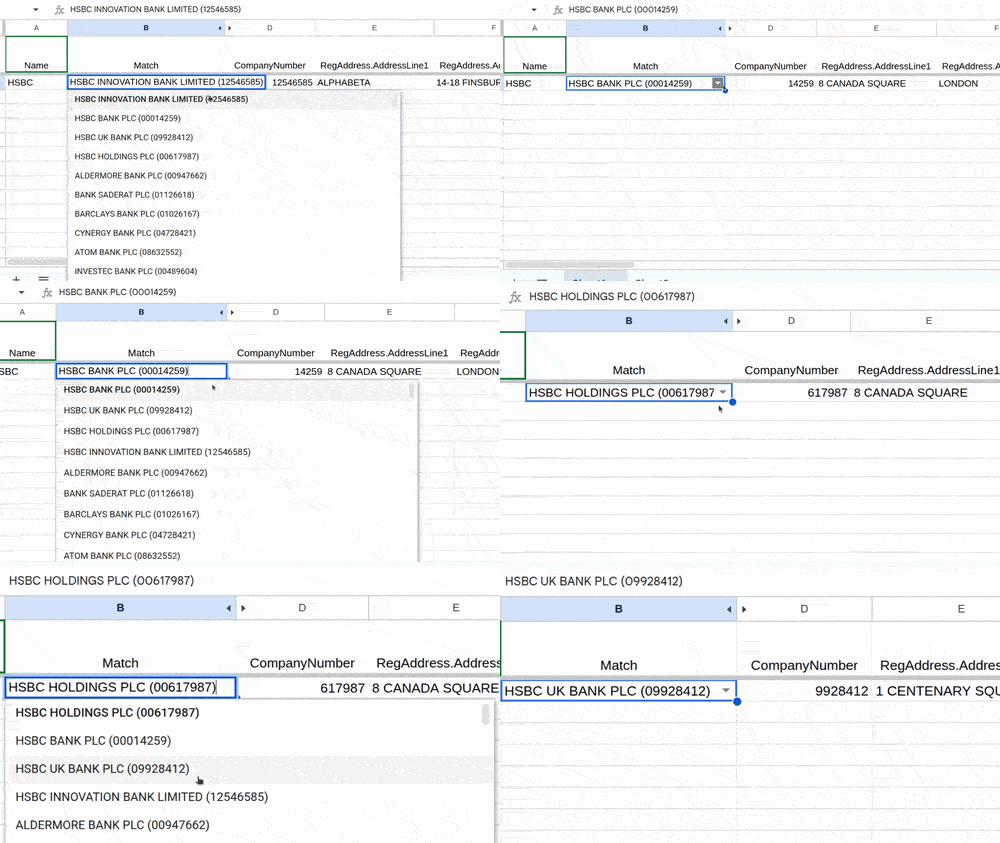
} Fast Data Science are pleased to announce we have updated the UK Company Details Google Sheets™ plugin. The plugin allows you to retrieve details such as company number, incorporation date, address, and directors’ details from Companies House (the UK company registry) and automatically populate them in columns of a Google Sheets™ spreadsheet.
We are all familiar with the general-purpose chatbots like Gemini, GPT, and Claude. Companies and organisations have also been creating internal and external facing special-purpose chatbots, such as those which can book flights, tell you the weather, answer healthcare related queries, or answer questions about government procedures.
What we can do for you