On 7 June, 2023, at 6pm UK time (1pm EDT), we will be presenting in the webinar Dash in Action: Image Processing, Forecasting, NLP. This is a community showcase hosted by Plotly, a company in Canada which makes the graphing software Plotly.
Sign up for the webinar at https://go.plotly.com/dash-in-action!
The speakers come from a variety of backgrounds, organisations and industries, all over the world:
NLP visualisation
We will be presenting the following apps:
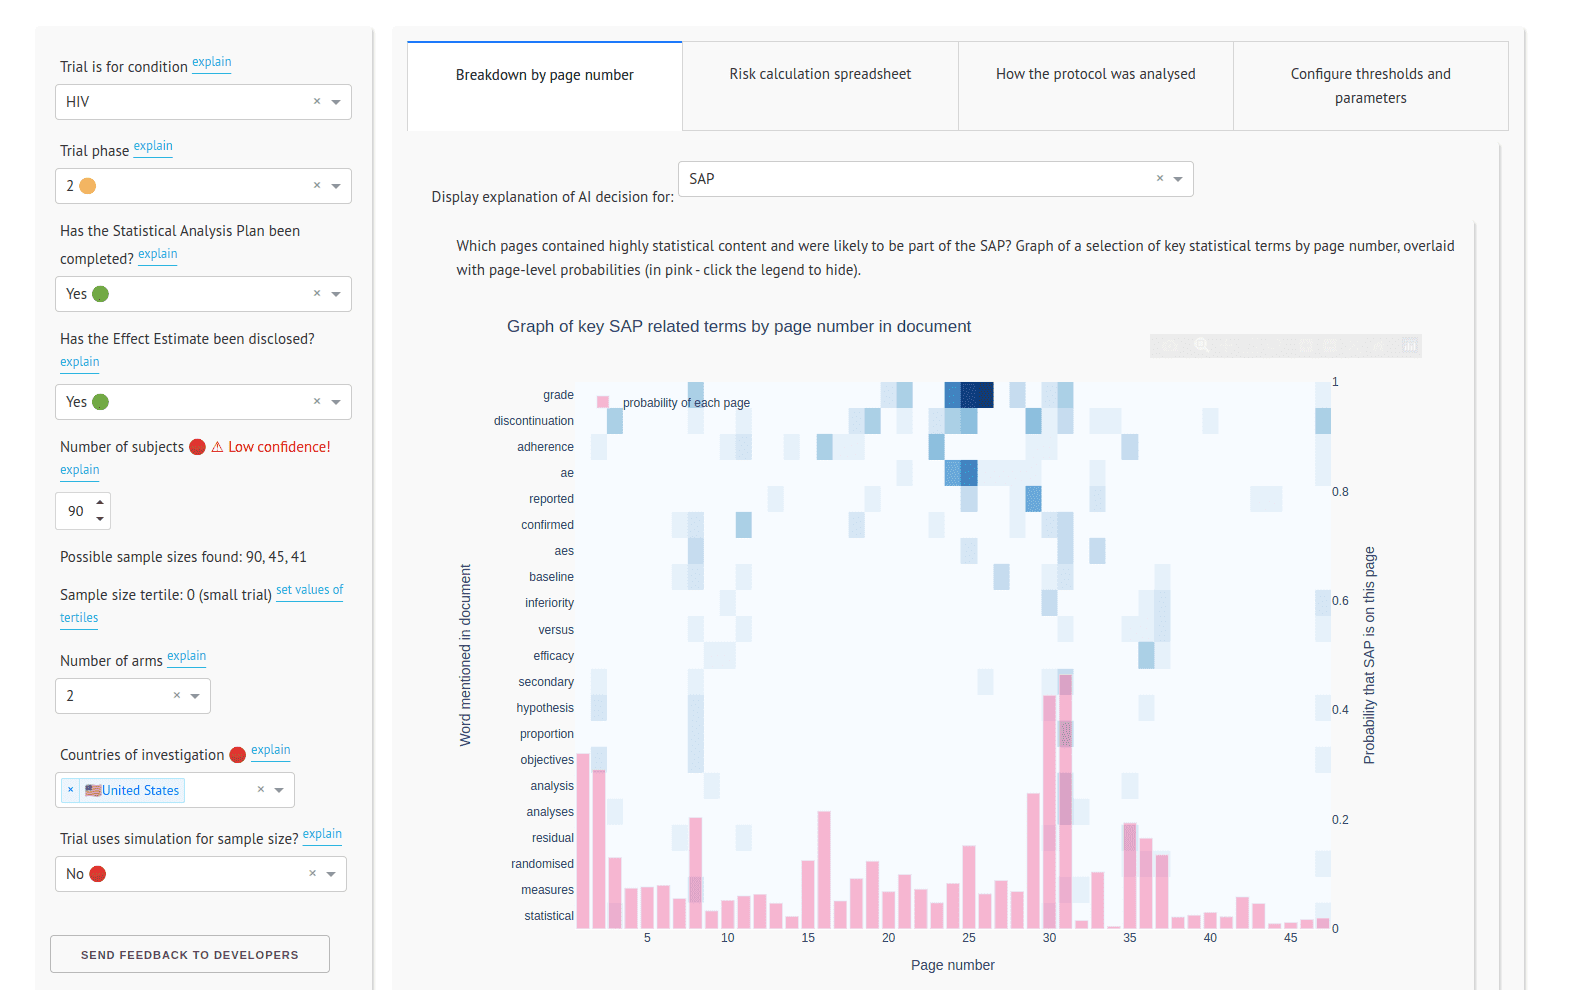
Thomas Wood has developed a dashboard funded by the Bill and Melinda Gates Foundation to analyse the risk of a clinical trial failing. The Foundation had a number of incoming clinical trials and they had a need to identify risk factors and triage the trials. When someone runs a clinical trial, they write a 200-page document which is called a protocol, which describes how the trial will be run, where it takes place, how many participants are needed, and how the data collected will be analyzed. Thomas built some natural language processing models which can identify risk factors in the text, and developed a front end in Dash allowing users to run the models and understand the decision making process.
Sharing this sneak peak of our upcoming webinar from Plotly's Community Manager, Adam Schroeder. Can you tell we're excited?!
— Plotly (@plotlygraphs) June 1, 2023
We have an impressive collection of data apps from #PlotlyCommunity members Thomas Wood, Gabriele Albini, Nadia Blostein, and Matteo Trachsel. Reserve… pic.twitter.com/f87UPXzSE3
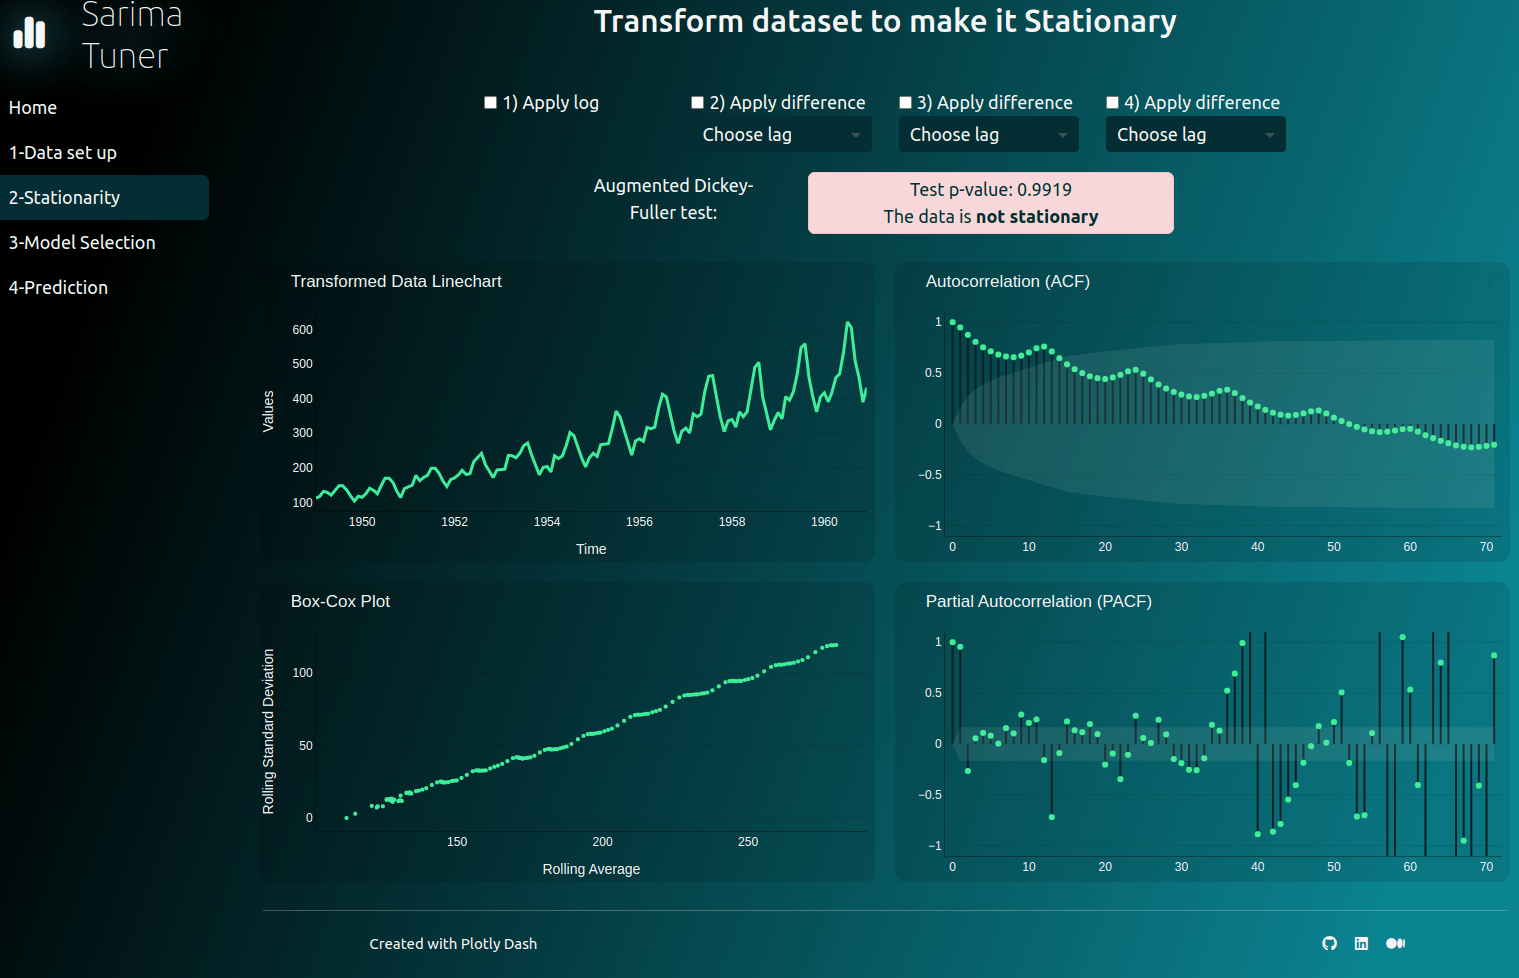
Gabriele Albini has developed a dashboard which allows users to experiment with sARIMA models (seasonal autoregressive integrated moving average). sARIMA models are models which allow us to predict time series with seasonality. For example, you may use a sARIMA model to predict daily electricity loads for a building or city, or to predict customer spend for a large supermarket.
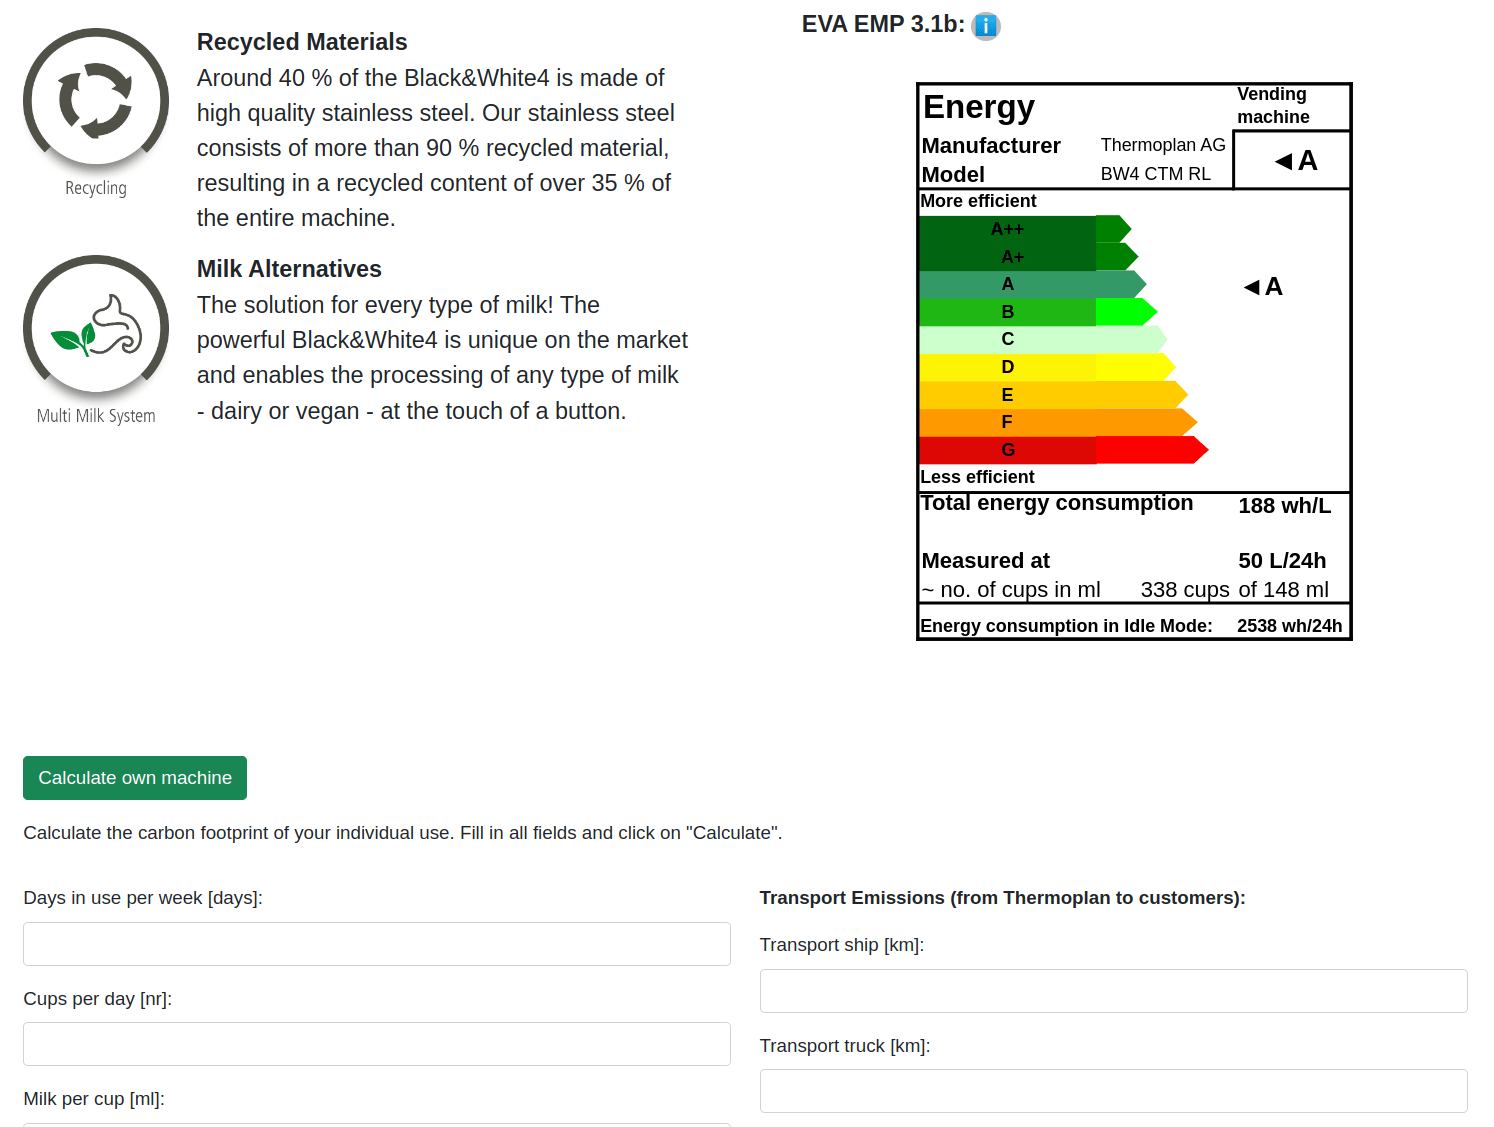
Try it at: https://report.thermoplan.ch/.
Matteo Trachsel works for the environmental consultancy Thermoplan and has developed a dashboard which calculates the carbon footprint of coffee machine usage.
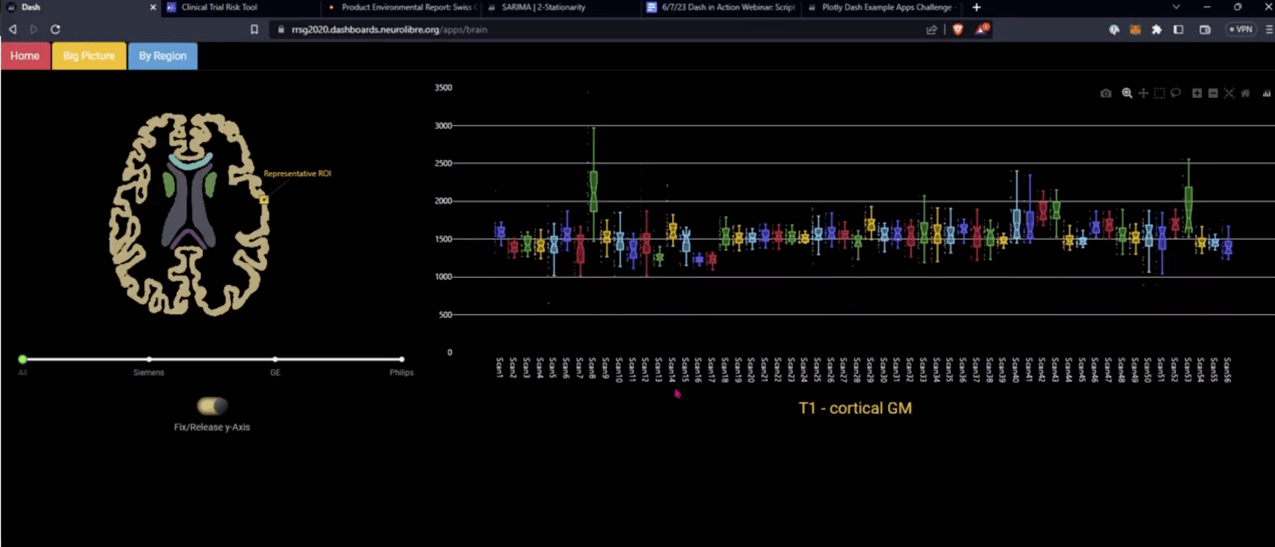
Try it at: https://rrsg2020.db.neurolibre.org/.
Agah Karakuzu at Polytechnique Montréal has built the RRSG 2020 Dashboard to accompany a scientific article on MRI. Neuroscientists are interested in a value called T1, which is the time it takes water molecules in the brain to return to their original state following a magnetic pulse. The purpose of the study was to assess the reproducibility of T1 values across different sites and vendors where researchers used the same research protocol. The dashboard allows researchers to compare datasets from brains and phantoms (calibration devices containing water, used to test MRI machines) from the three main MRI machine vendors (Phillips, GE and Siemens). This will be demonstrated by his colleague Nadia Blostein.
If you would like to cite the tool alone, you can cite:
Wood TA and McNair D. Clinical Trial Risk Tool: software application using natural language processing to identify the risk of trial uninformativeness. Gates Open Res 2023, 7:56 doi: 10.12688/gatesopenres.14416.1.
A BibTeX entry for LaTeX users is
@article{Wood_2023,
	doi = {10.12688/gatesopenres.14416.1},
	url = {https://doi.org/10.12688%2Fgatesopenres.14416.1},
	year = 2023,
	month = {apr},
	publisher = {F1000 Research Ltd},
	volume = {7},
	pages = {56},
	author = {Thomas A Wood and Douglas McNair},
	title = {Clinical Trial Risk Tool: software application using natural language processing to identify the risk of trial uninformativeness},
	journal = {Gates Open Research}
}
Dive into the world of Natural Language Processing! Explore cutting-edge NLP roles that match your skills and passions.
Explore NLP Jobs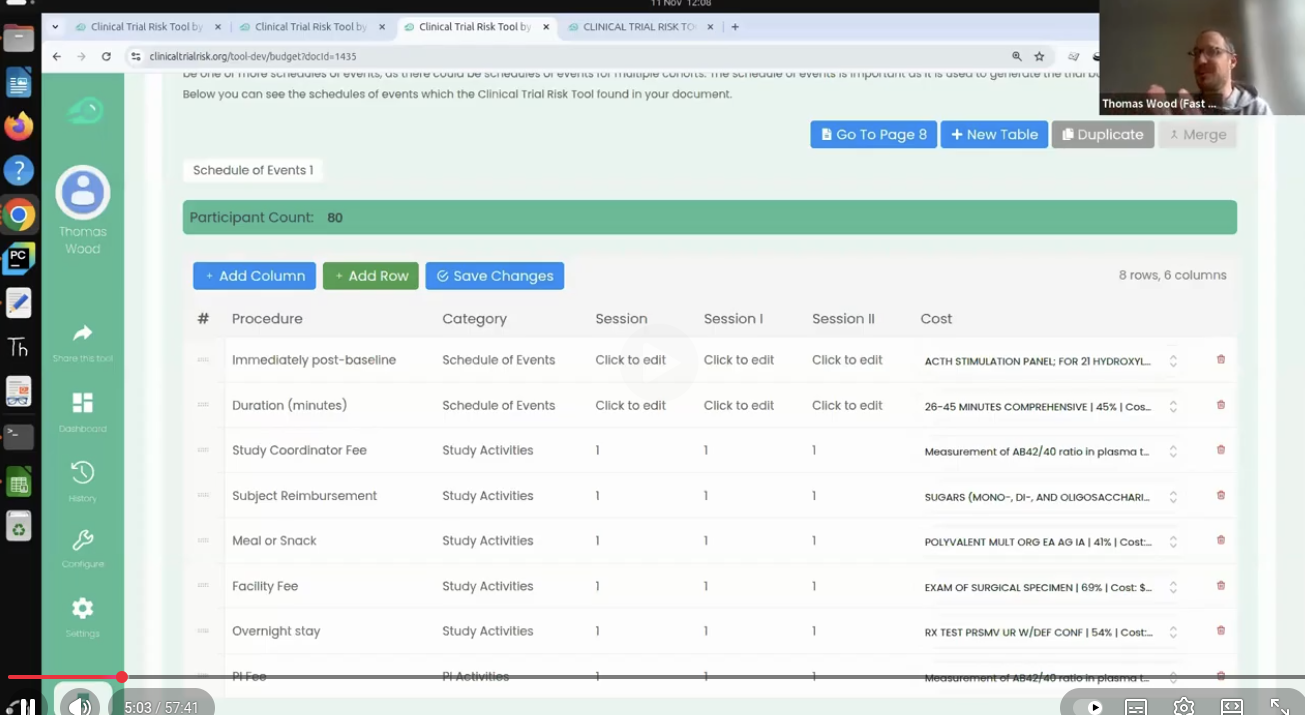
Fast Data Science Ltd’s flagship AI platform, the Clinical Trial Risk Tool, has been accepted as a supplier on the UK Government’s G-Cloud 15 framework.
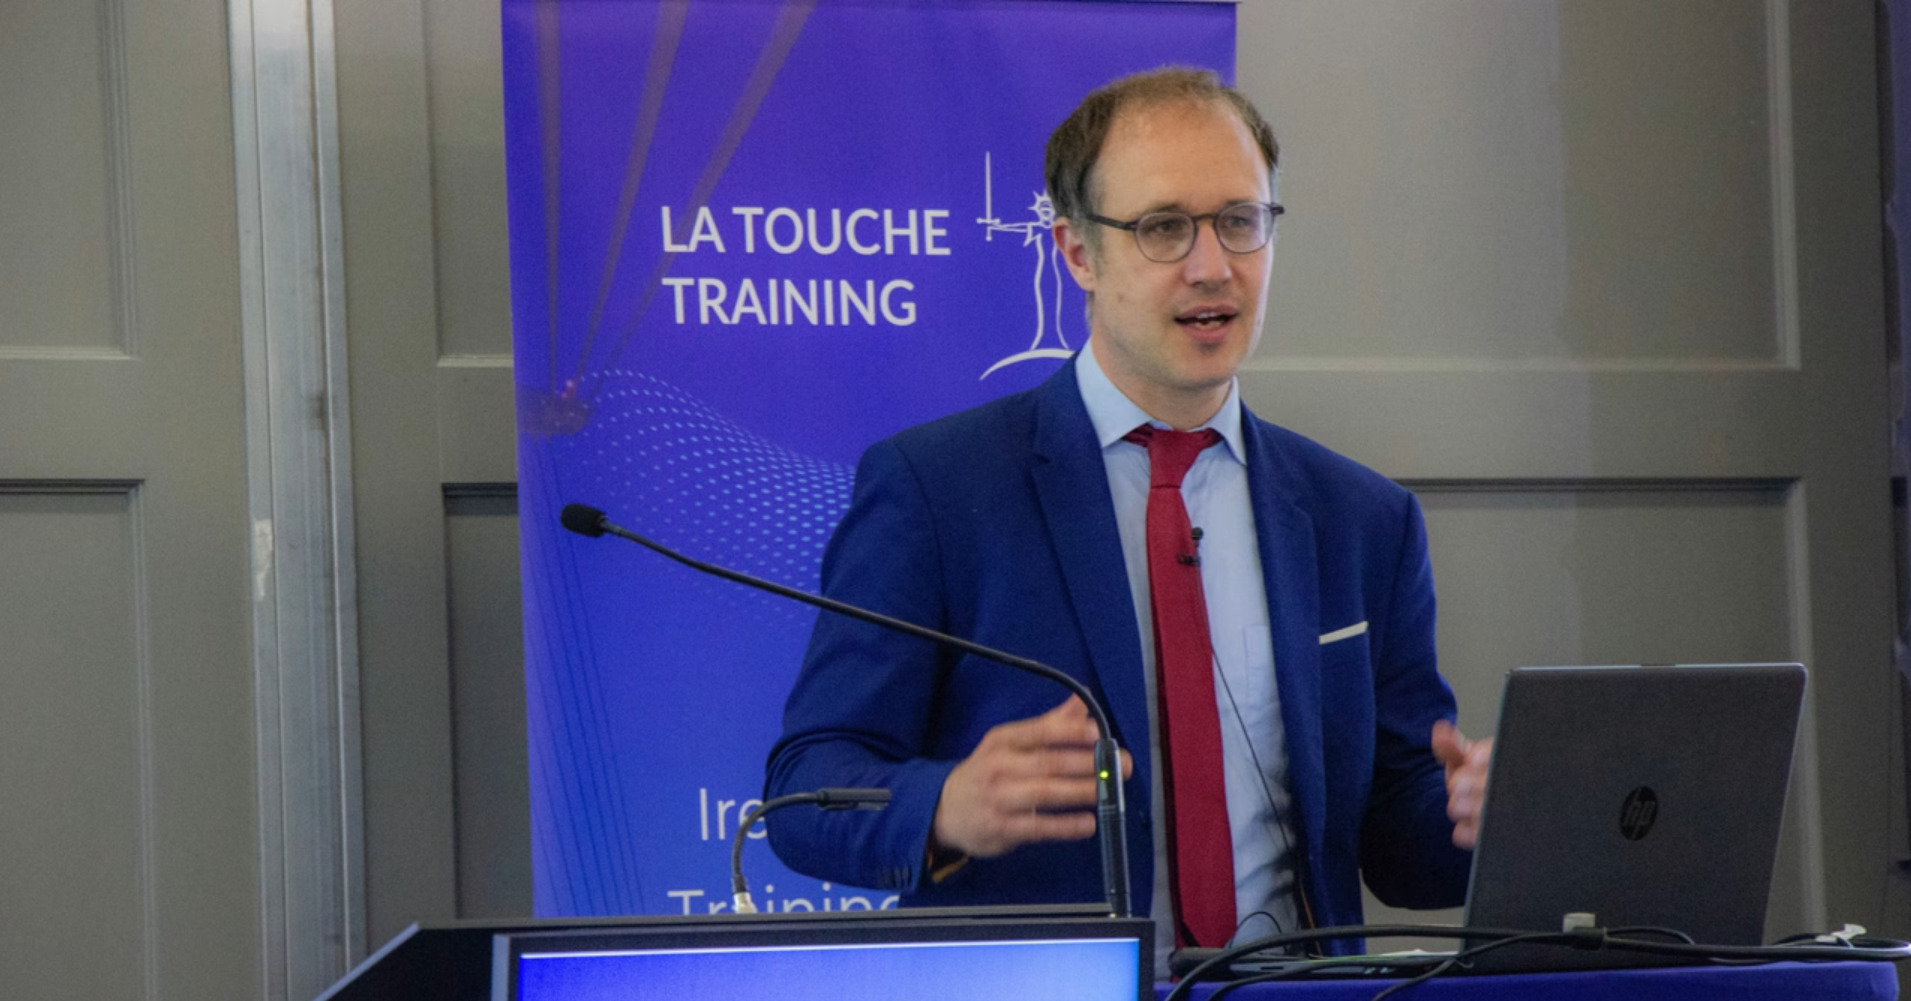
We are pleased to announce that Thomas Wood, director of Fast Data Science, will be appearing as a panelist at the Bond Solon Expert Witness Conference on 6 November 2026 at Church House, Westminster in London. This follows Thomas’s recent appearance at the Ireland’s Expert Witness Conference on 20 May 2026.
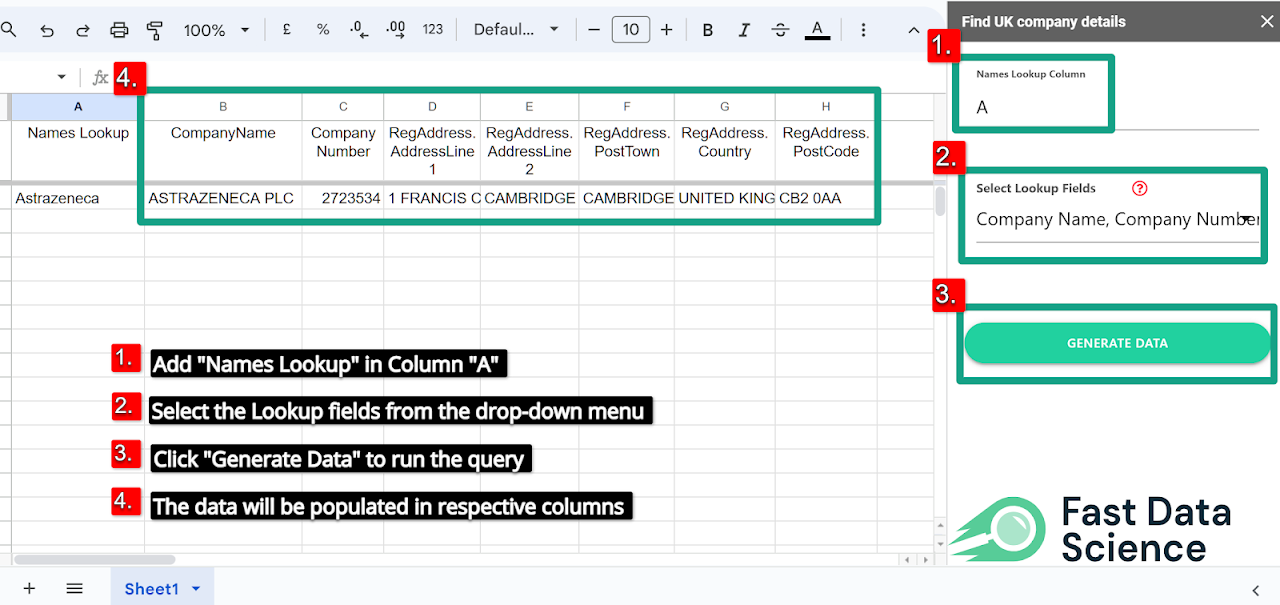
Fast Data Science are pleased to announce we have updated the UK Company Details Google Sheets™ plugin. The plugin allows you to retrieve details such as company number, incorporation date, address, and directors’ details from Companies House (the UK company registry) and automatically populate them in columns of a Google Sheets™ spreadsheet.
What we can do for you