
Does your organisation have large amounts of unstructured text data, and are you finding it hard to visualise it?
Would you like to allow an internal or external audience to explore your dataset interactively?
An interactive dashboard could be the answer. We can use natural language processing to analyse, categorise and structure your data, and a dashboard is the natural way to present complex text datasets to an audience.
An NLP dashboard is a web page that allows users to explore a large text dataset and gain insights using natural language processing technology. You can see a working NLP dashboard which we built for White Ribbon Alliance here for their What Women Want campaign.
Want your own NLP dashboard?
NLP dashboards can be used to analyse free-text survey responses in use cases across industries, including employee complaints, patient reviews, customer reviews, staff survey results, and even KOL (Key Opinion Leader) insights in the pharmaceutical industry (see case study of one of our KOL insights projects).
The pace at which data has grown (along with its value) in the past few decades, has made it a huge asset for businesses of all sizes and sectors. Once this data is processed into a proper structured format, it’s stored on a database and then formatted into tables. Whenever a business needs to make key decisions, they run a query on their data to fetch reports and visualise them. Interacting with data, therefore, becomes critical.
However, there are currently limitations in the way a user may interact with databases to fetch the required reports or information:
For example, we worked on a project where a manufacturer had large amounts of error reports written in plain English, and a British council (local authority) with huge volumes of enquiries from residents about topics such as taxes, bin collection, and Covid regulations. Such unstructured datasets do not easily fit into a traditional database and are hard to visualise with BI tools. Natural language processing and unsupervised learning can be used to find clusters and discover topics and trends in the data, and an interactive dashboard is the best way to present insights to stakeholders.
For this kind of business challenge, we can build a dashboard powered by natural language processing – an NLP dashboard – on a bespoke basis for any organisation where a lot of documents or textual data must be accessed on a regular basis – for the purpose of exploration by the general public the business caters to, customers, marketing professionals, or to let internal teams make business-critical decisions.
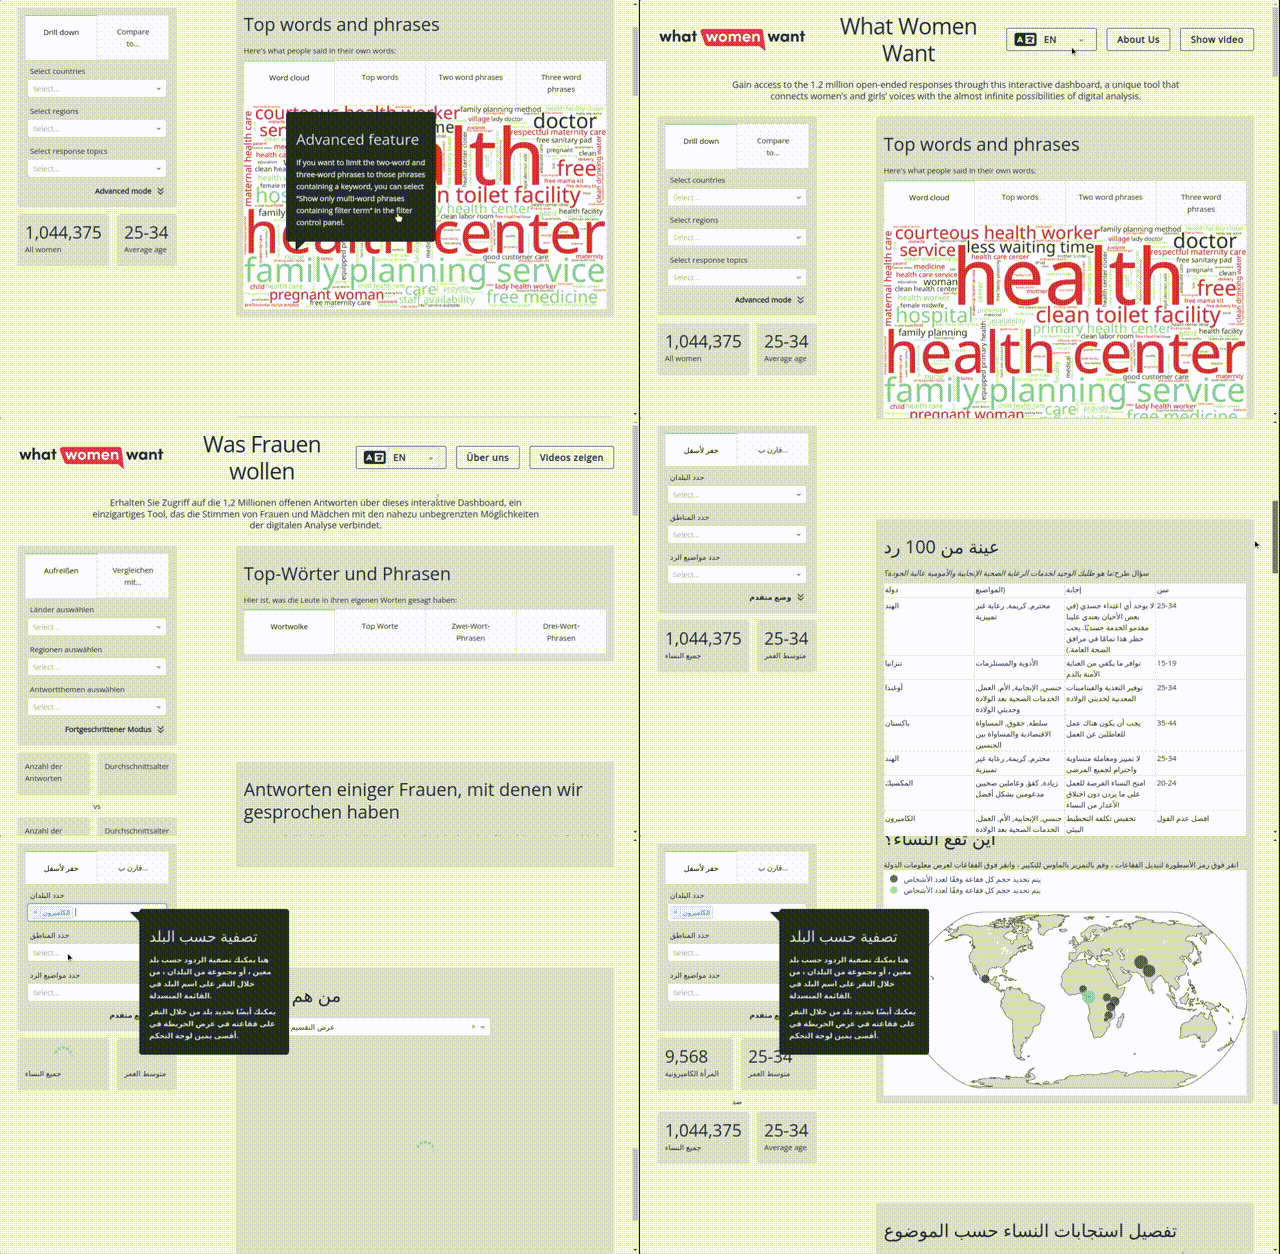
The Dash App Gallery has an awesome selection of sample dashboards for you to explore, from financial reports, to cellphone towers, and even a brain surface viewer!
NLP dashboards can be standalone pages, or can be embedded inside a content management system such as WordPress.
A simple interactive control can be embedded in a website, article, or blog post, or deployed as a standalone dashboard, and enables a user to visualise and explore data in a more engaging way than a static graph or table would allow. A dashboard may have multiple controls and interactive graphics and allow a user to explore the dataset from more angles.
🌐 Visit the dashboard at wypw.1point8b.org.
Client: PMNCH (Partnership for Maternal, Newborn & Child Health), a division of the World Health Organization. Initially commissioned in partnership with White Ribbon Alliance.
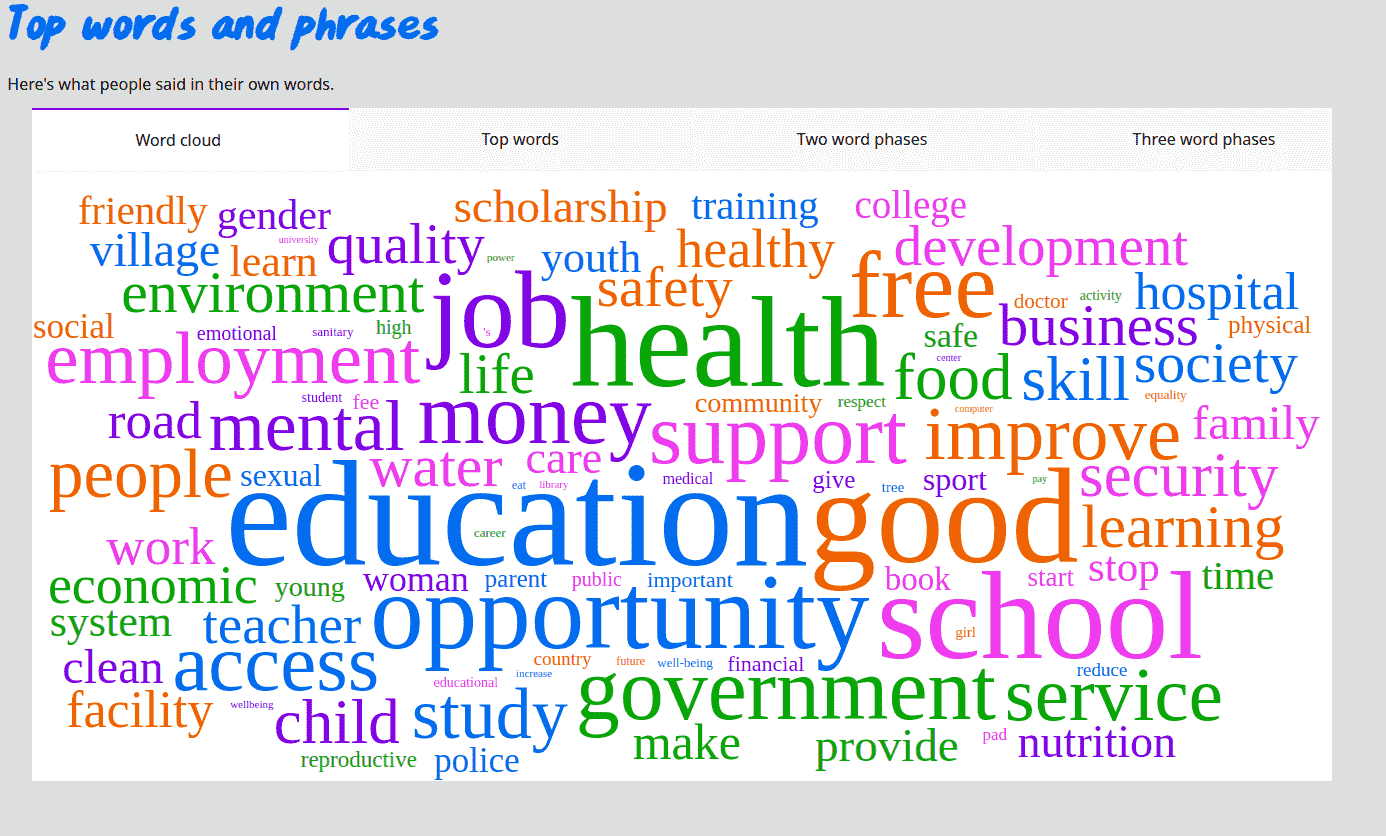
Above: screenshot of PMNCH What Young People Want NLP Dashboard
🌐 Visit the dashboard at explore.whiteribbonalliance.org/en/giz.
Client: GIZ México (Deutsche Gesellschaft für Internationale Zusammenarbeit, the German international development agency) and White Ribbon Alliance.
White Ribbon Alliance and GIZ wanted to represent answers from women in Mexico City to questions such as ¿Qué es lo que más deseas o necesitas para encontrar empleo o un mejor empleo? (What do you most want or need to find a job or a better job?).
We received responses from 10,603 women, and we trained an NLU model in Spanish to categorise these into groups, and we are displaying them in a dashboard that allows users to browse raw responses and trends in Spanish or English.

Above: screenshot of GIZ México Women’s Economic Empowerment in Mexico NLP Dashboard
🌐 Visit the dashboard at whatwomenwant.whiteribbonalliance.org.
Client: White Ribbon Alliance.
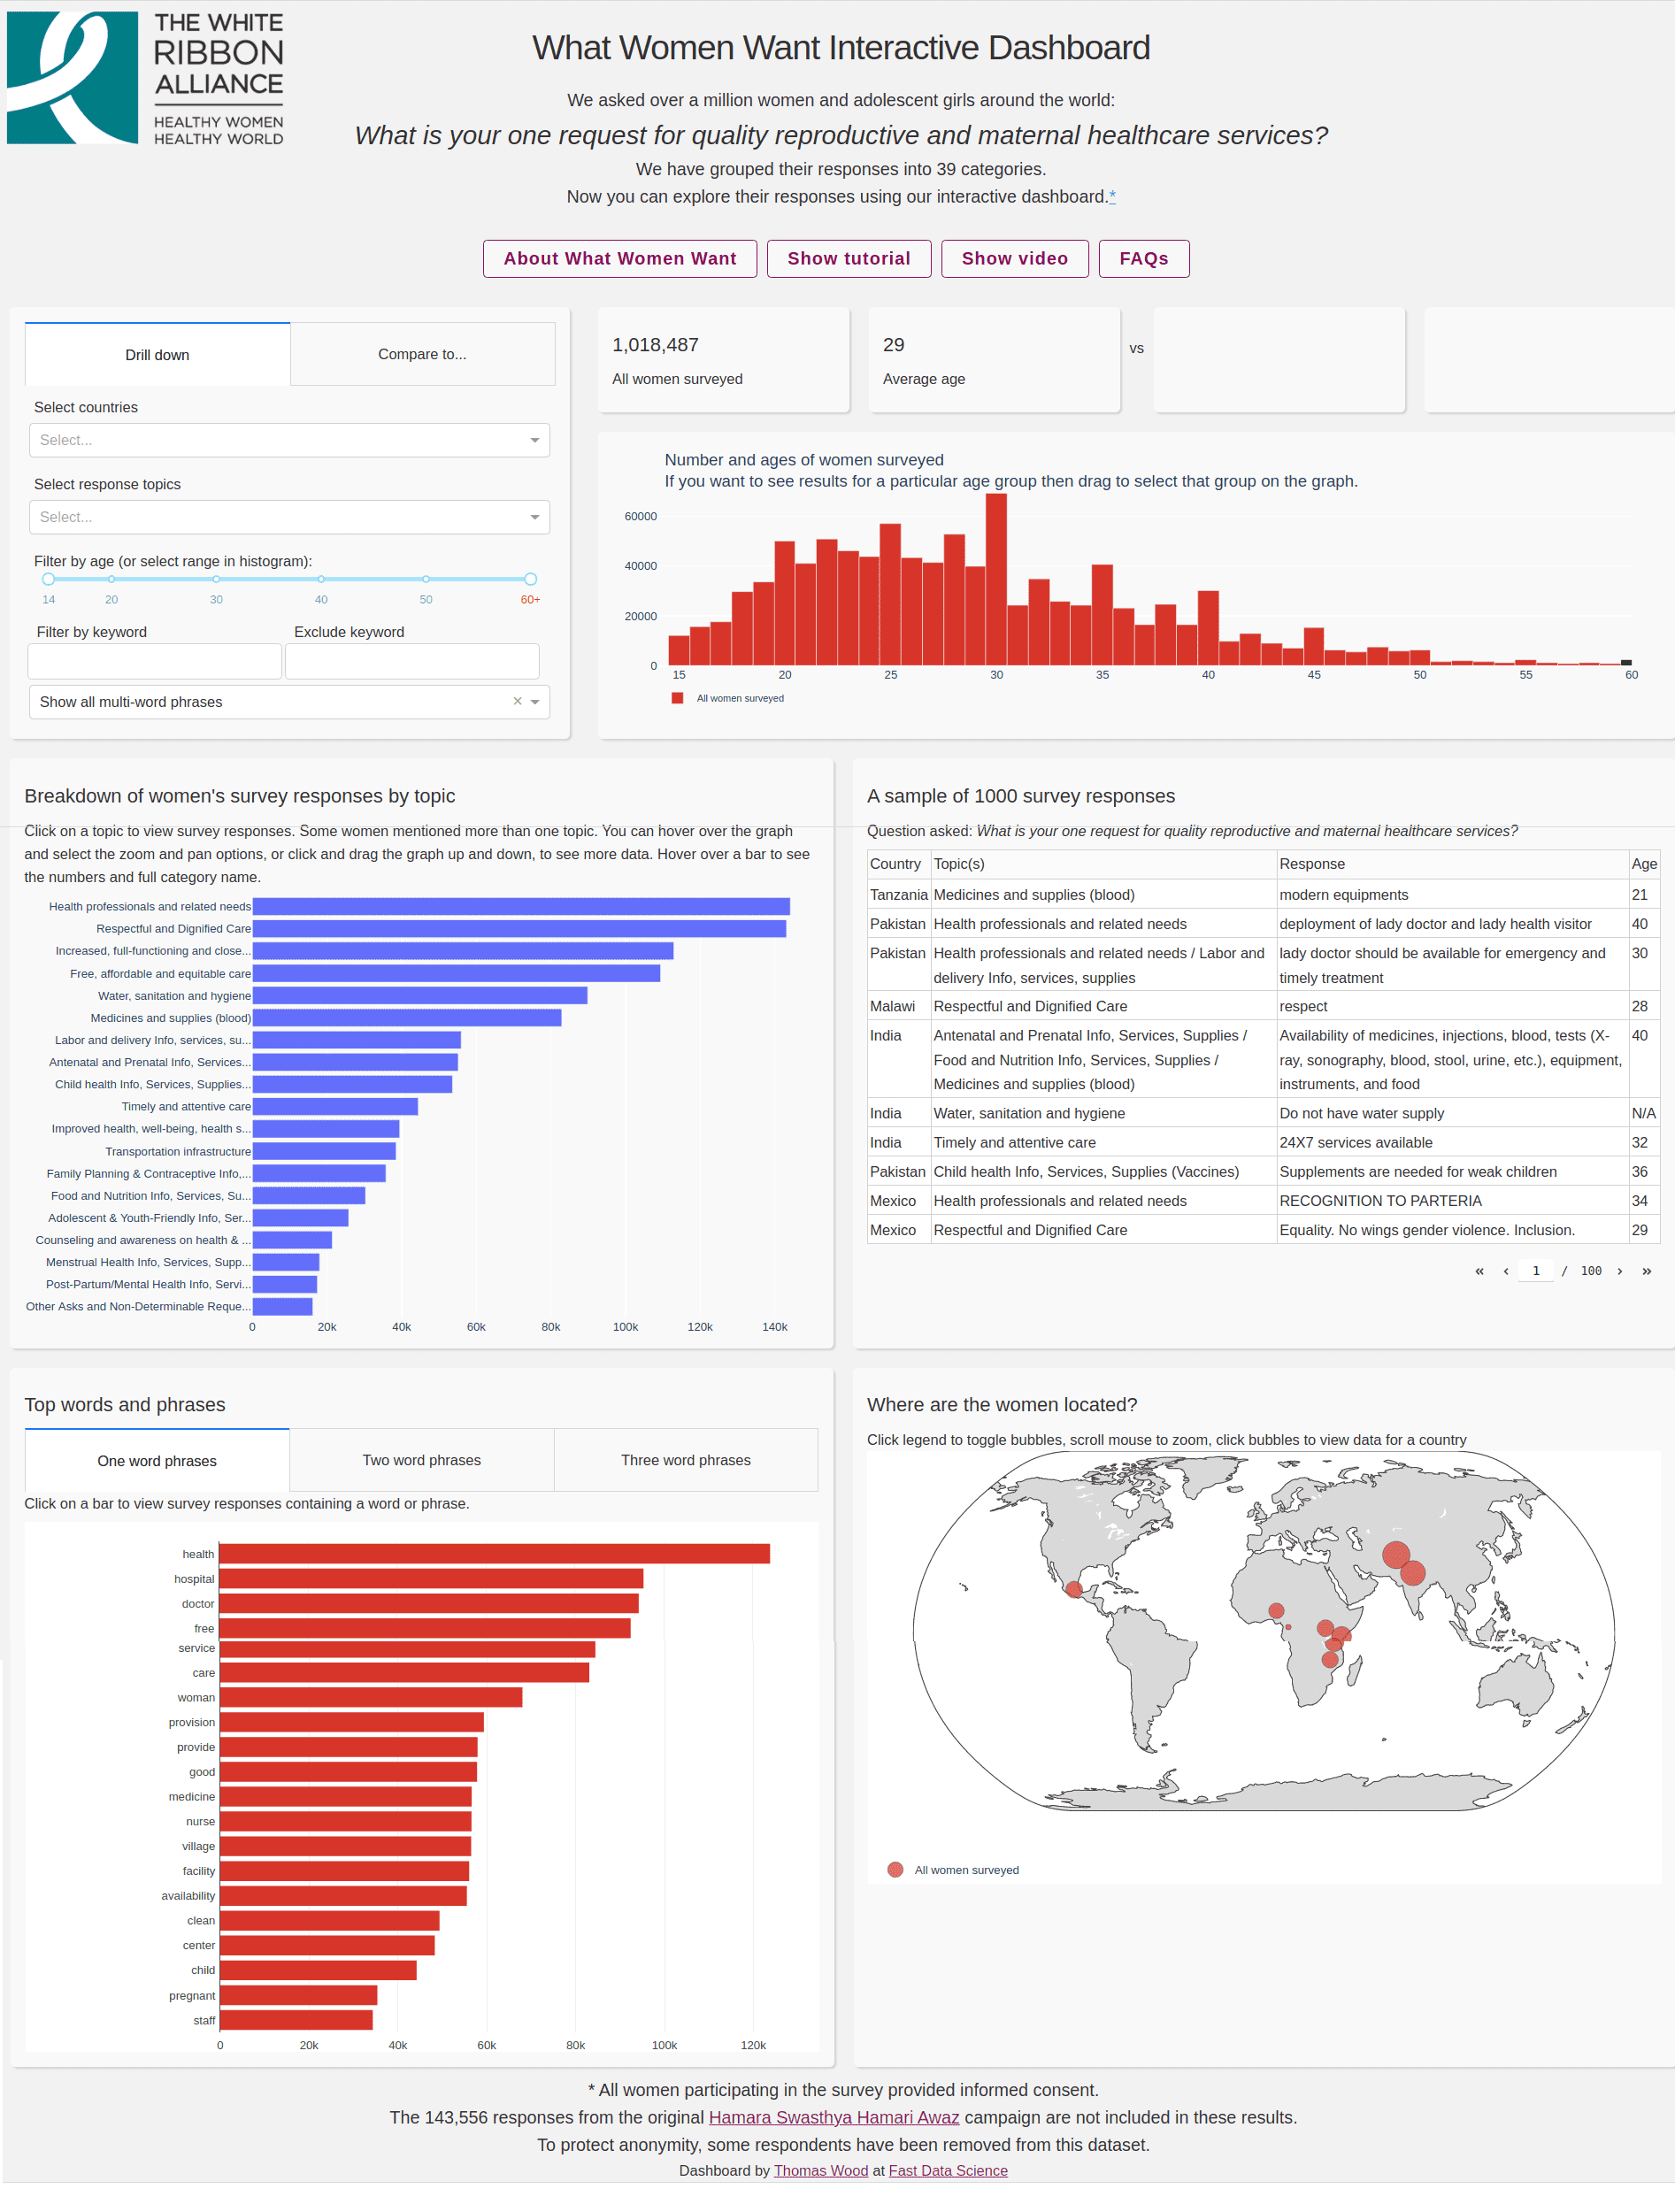
The WRA asked over 1 million women asking them about their top requests for maternal and reproductive healthcare. The survey focused on eight countries: Mexico, Cameroon, Nigeria, India, Pakistan, Malawi, Uganda, Kenya and Tanzania. The responses came back in text format (instead of categorical responses), in a variety of spellings and even languages, which made the survey difficult to analyse on a global scale.
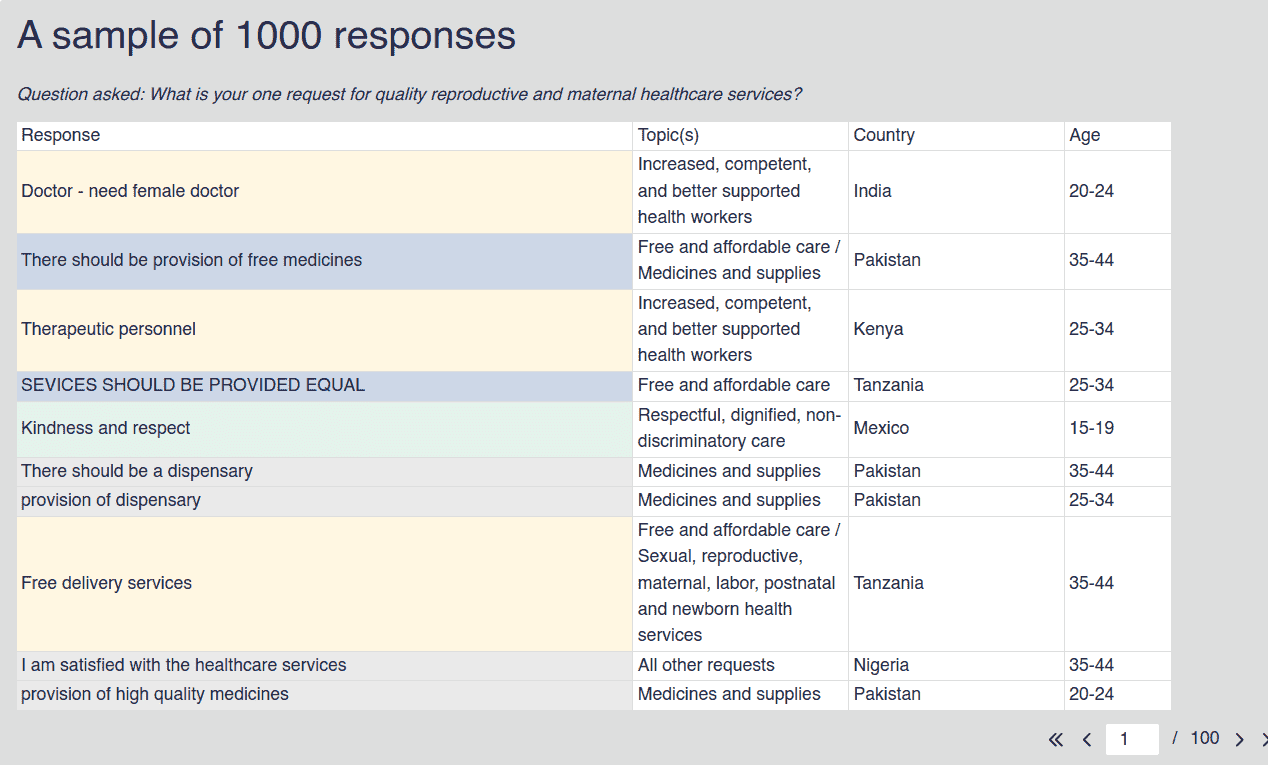
Above: screenshot of White Ribbon Alliance’s What Women Want NLP Dashboard
Did you know that Google’s technology relies heavily on natural language processing (NLP) and machine learning (ML) to display accurate search results? Google has a number of NLP dashboards allowing the public to explore their vast text datasets, including:
If you’re not sure whether an NLP dashboard may benefit you in some way or the other, then consider the following:
Through the latest innovations in natural language processing and machine learning, we help you analyse, categorise and structured data. A natural language processing dashboard, therefore, is a very ‘natural’ way to present highly complex textual datasets to everyday audiences and team members. Our team uses cutting-edge technology to build bespoke NLP dashboards per your requirements, including: Microsoft Azure, Google Cloud Platform and Plotly Dash.
If you’re generally unfamiliar with what a digital dashboard, interactive dashboard or NLP dashboard is, then a quick explanation is in order:
A digital dashboard is a business intelligence tool that gives a visual representation of data. Dashboards are commonly used to track business metrics, understand general company performance, relay ‘need to know’ information to team members or the general public or to make critical business decisions. Companies have traditionally had an Analytics team build dashboards using tools such as Microsoft Power BI and Tableau.
For example, since the start of the Coronavirus pandemic, dashboards have been commonly used to display infection and death rates around the world or at a subnational level in an eye-catching and graphical way, allowing users to zoom in and select date ranges, and allowing the freedom to explore a dataset which would not be possible with a static graphic.
Traditional digital dashboards usually do not aim to display unstructured data such as text. However, with the addition of Natural Language Processing to the mix, NLP dashboards can be used to explore unstructured datasets, such as large collections of documents. NLP dashboards make use of natural language processing and machine learning and may be developed in a language such as Python.
As an NLP dashboard user, all the complex data that you have fed into your databases can be condensed into graphs, numbers and visualisations – showing historical trends, actionable insights and live information, all presented in a very digestible and easy-to-understand format.
Most companies, irrespective of their scale or sector, are required to analyse complex datasets and then present information in an easy and user-friendly format to either team members to better guide them and have them make decisions, or to show certain trends to their target audience, general public and stakeholders, investors (or all of the above).
This is where a natural language processing dashboard customised to a business’s precise requirements comes in handy – a means of acquiring vital information at a glance in order to make decisions without second-guessing anything.
One of the ways in which an NLP dashboard can help you is by determining current and future trends, which in turn, will help you make the right decisions to keep everyone happy: from customers and staff members to the general public, stakeholders, vendors and investors.
Here are more ways an NLP dashboard can benefit you:
Critical decision-making – Being highly accessible, visual and interactive in nature, digital dashboards allow you to make very quick decisions, powered by data and insights which are very easy to understand and act upon. No matter which aspect of the business these decisions may pertain to, you’ll always have the information needed to analyse and get into the depth of important insights as well as metrics with relative ease – all of which will influence the decisions you make.
Accessibility & ease-of-use – Since NLP dashboards offer intuitive and easy-to-understand data in the form of graphs, interactive diagrams, illustrations and key numbers/metrics, there’s no in-depth training required as such, whether the end-user is your internal team or anyone not related directly to the business such as the general public or investors. NLP dashboards, by definition, are designed for easy accessibility and simple navigation, which is the cornerstone of what we do at Fast Data Science.
Business intelligence (BI) superiority – business intelligence involves specific technologies and strategies used to analyse business information in order to make decisions based on data, and not just those based on your ‘gut instinct’. This gives you a far better understanding of the local and global market(s) you’re in as well as insight into how your company is performing. In addition, when you have access to past, current (live) and predictive analytics as well as clear-cut KPIs for growth and professional development, you can enhance your BI skills even further, which means ultimately, you can get ahead of the competitive curve a lot faster.
Performance benchmarking – Irrespective of your business scale or the sector you’re in, one of the best ways to meet and, perhaps, exceed your goals, is by defining benchmarks which clearly align with your key objectives. NLP dashboards feature dynamic and interactive KPIs which not only provide vital information in real-time but also provide a deeper understanding of what you should do to hit your next milestone.
Communication – Any kind of organisational silos will stunt your productivity and bring innovation to a halt. The flexible and detail-oriented nature of BI-focused NLP dashboards makes discussing and sharing data-driven discoveries a very swift and simple process. Subsequently, the interactive dashboard tools boost cross-team communication while also eliminating any barriers to communication – all departments will be on the same page as a result, something which is now even more important in this “always digital” era.
At Fast Data Science, we help organisations across all sectors, irrespective of their budget or business goals, extract the most meaningful information and value from unstructured data. Unlike some of the other data science consulting services operating today, we never overwhelm you with technical jargon and buzzwords, academic credentials or the like. Our solutions represent practicality, simplicity and ease-of-use throughout – the natural language processing dashboards we build on a bespoke basis from company to company, are a faithful representation of this philosophy.
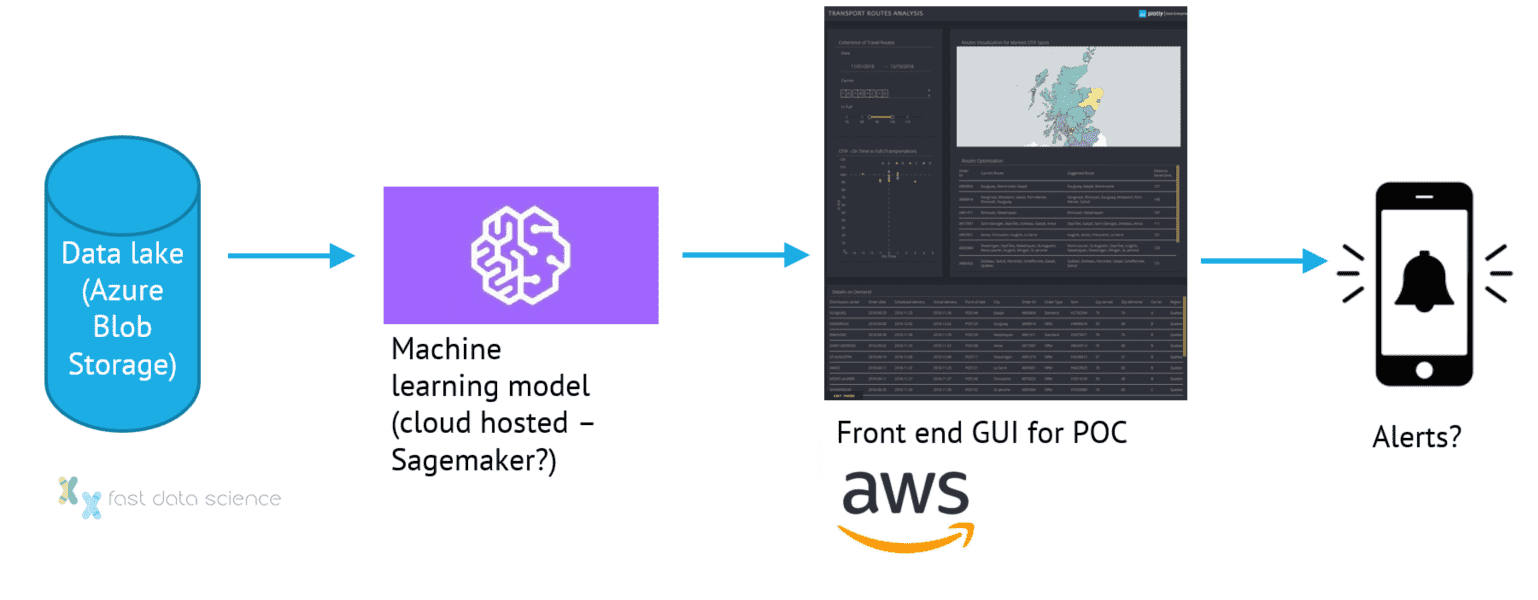
Above: a possible architecture for an NLP dashboard. The dashboard connects to a machine learning model, which is itself connected to a data lake. If the client requires, an alert facility can be provided.
Now that you’re familiar with what a natural language processing dashboard is and how it can help your business, let’s explore some of the ways in which Fast Data Science can help you implement it from a sector-specific standpoint:
You’ve probably answered a market research survey that made heavy use of questions on the Likert scale, which ranges from “Strongly Agree” to “Strongly Disagree”. This can sometimes be a frustrating experience as a survey respondent. A common problem encountered by market researchers is the difficulty of analysing free-text responses. Most market research surveys try to stick to numeric scales such as the Likert scale in their survey design, due to the greater ease of statistical analysis.
Unstructured text and NLP dashboards
NLP dashboards allow researchers to explore free-text answers and even analyse them and cluster them in real-time, freeing up market researchers to use more dynamic survey designs with more free-text fields. This also gives survey respondents freedom to answer in their own words, rather than being constrained to a number of set questions.
An NLP dashboard can be connected to a CRM, allowing stakeholders in a business to monitor the current sentiment in customer complaints, and spot and quickly react to emerging trends.
We can set up an NLP dashboard to monitor sentiment about your business or product on social media and forums. A social media feed or API can be connected to NLP models such as sentiment analysis and named entity recognition, allowing you to detect emerging trends in real-time, and visualise topics on a map view.
A common problem faced by researchers across fields, from pharmaceuticals to physics, is the difficulty of keeping up with the onslaught of abstracts that appear on a daily basis. It’s especially hard for researchers in biological sciences where names of enzymes and proteins can range from the mundane to the ridiculous (Sonic Hedgehog protein?). NLP can be used to sift through unstructured data and identify entities of interest, and a dashboard can display insights. For example, an NLP dashboard could display all proteins in a set of documents on a graphical view and link them according to their purported associations.

Interested in scientific or biomedical named entity recognition, i.e. picking out names of products, drugs, enzymes, proteins from messy text? Do you need to resolve unstructured drug names in texts? Try out our:
Pharmaceutical companies are often sitting on a goldmine of data in terms of their interactions with Key Opinion Leaders (KOLs). These are often transcripts of phone calls between pharma reps and medical professionals, who have stated opinions such as “we have seen an unusual number of AEs with Dabra” (AEs = ‘adverse events’ and ‘Dabra’ = ‘Dabrafenib’). An NLP dashboard allows the pharmaceutical company to sift through large numbers of transcripts and even identify correlations automatically (“68% of KOLs reported no AEs with Dabrafenib”). NLP dashboards are delivering huge value in the pharmaceutical industry.
The day-to-day job functions of a Chief Marketing Officer are varied and equally stressful. Each day, they must have access to a wealth of high-quality and up-to-the-minute data from a single source in order to make key decisions.
Our dynamic NLP dashboard for CMOs is full of interactive charts, metrics and KPIs that makes the ‘live’ decision-making process a more informed, timely, accurate and valuable one. Having access to in-depth information on unstructured marketing data will delight CMOs as they see their ROMI (return on marketing investment) rise higher each year.
What people are saying about your products, services or brand at any point in time can truly make or break your reputation. In case of the latter, it can be very difficult to rebuild something which has taken years of trust and loyalty to build.
Our NLP dashboard for measuring customer sentiment is a great way to stay on top of what people are saying about your business. Main KPIs in this case would be overall customer sentiment (positive, negative or neutral), feedback about specific services and/or products, and the total number of customers who are either completely happy or unhappy with what you’re offering.
A sentiment analysis natural language processing dashboard is a great way to showcase consumer data to stakeholders, investors or the general public, as well as share insights with your internal team. Spot trends and patterns and take the necessary action before any negative sentiments tarnish your brand name.
All in all, we’ve explained what a natural language processing dashboard is and what it can do for your business, along with key benefits and specific use-cases. By now, it should be abundantly clear that every business, regardless of their scale or sector, can reap tonnes of benefits by having an NLP dashboard built around their needs.
Natural language processing dashboards are a powerful, interactive, intuitive and information-driven way to boost internal business intelligence and offer everyone related directly and indirectly to your organisation, the kind of insight which will inevitably lead to improved performance and efficiency – as well as foster better, more cohesive communications and increase efficiency of operational processes all across the board.
Digital dashboards have become vital to the commercial success of just about any business under the sun and happen to be the very best in digital tools for acquiring and presenting business intelligence, which will pave the way for well-informed decisions and actionable results. This will also help you set benchmarks in your sector and remain adaptable in a business environment that’s always changing and evolving.
By choosing Fast Data Science as your NLP dashboard partner, you can harness the power of these simple yet highly insightful digital tools to reap commercial benefits and rewards like never before. Your competitors are doing everything possible to outrank, outperform and outmanoeuvre you – why should you remain on the sidelines, and just let them claim what can be yours?
For more insight into how these data-driven tools can help your business and how to best use them to propel your offerings even further, here’s a real-life NLP dashboard designed by our team.
Get in touch with our NLP dashboard experts now to explore a variety of business-boosting options. Make life easier by having actionable insights and key information right at your fingertips at all times.
At the core of our services are the latest, cutting-edge methods for extracting high-value data from unstructured text, machine learning, natural language processing, etc. – all with the help of AI to build a healthier and more productive world.
Having served clients like Tesco, the NHS, Registers of Scotland and CV-Library, to name a few, we’re proud to be a leader in data science services, which include expansive consulting on natural language processing, AI for due diligence, healthcare and pharmaceuticals, machine learning model deployment, public sector procurement for AI projects, and more.
What we can do for you