Imagine that you work for a market research company, and you’ve just run an online survey. You’ve received 10,000 free text responses from users in different languages. You want to quickly make a pie chart or bar chart showing common customer complaints, broken down by old customers, new customers, different locations, different spending patterns, and demographics.
This might seem like a straightforward answer - “just drag and drop your survey responses into OpenAI” - but it’s a little more complex. This is a common problem in market research projects, where data is gathered in both numerical form (e.g. Likert scales) and free text (e.g. What do you think could be improved about the service?).
ChatGPT has a limit on the file sizes that it can process. If you were to just upload an Excel of too many survey responses to GPT, you would also find that GPT’s context window would start to cause problems. GPT may assign a disproportionately high importance to the last responses in the list. There’s also the issue of reproducibility: if you did this multiple times in ChatGPT, you would get different summaries each time. Furthermore, GPT’s summary might exhibit semantic leakage, and fail to accurately separate the effects of the different survey response inputs.
We recently did a market research analysis for a company in the finance space. We had an online survey with free text responses from existing customers of the company.
I will talk through how we approached the survey analysis as I think this is a very useful technique for analysing unstructured survey data. I will use synthetic data from a fictional supermarket customer survey which I have put on a public repository in Github here: https://github.com/harmonydata/harmony_examples/blob/main/tw_analyse_clusters_with_harmony.ipynb
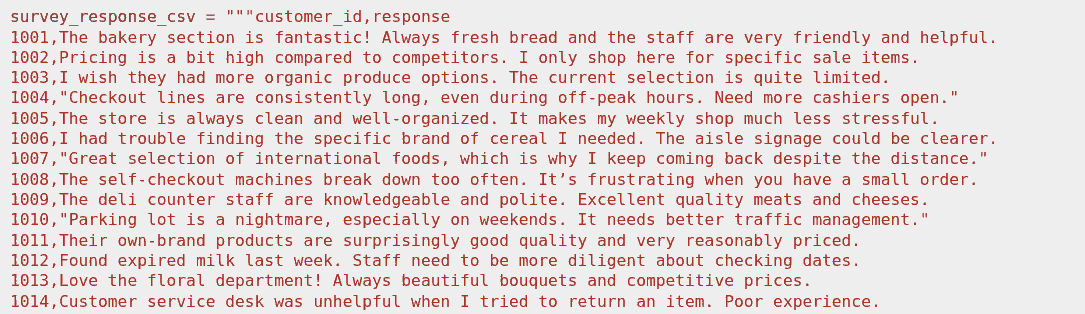
Above: the first few lines of the free text data from a customer survey for customers of a supermarket. This is synthetic data that I generated with Gemini for the purpose of this walkthrough.
The client company had already sanitised and preprocessed the texts before passing them to us, which makes our task a little easier: the responses had already been anonymised and translated to English if they were not originally in English. However, this analysis would still be possible on raw unprocessed text data.
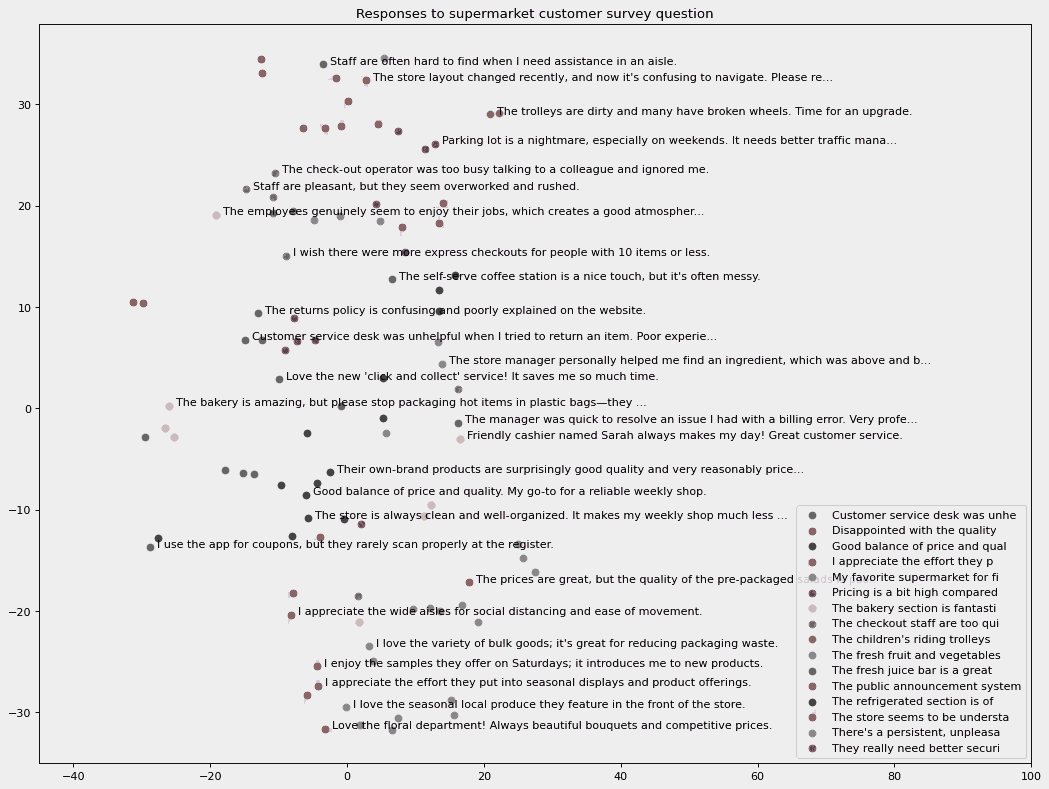
We used the Python library Harmony to identify clusters and topics in the input responses from the survey. Harmony converts all the text items to a vector representation. It then clusters them in multi-dimensional space and identifies the centroids of each cluster. (We have been involved in the development of the Harmony library; you can find its Github repository here: https://github.com/harmonydata/harmony )
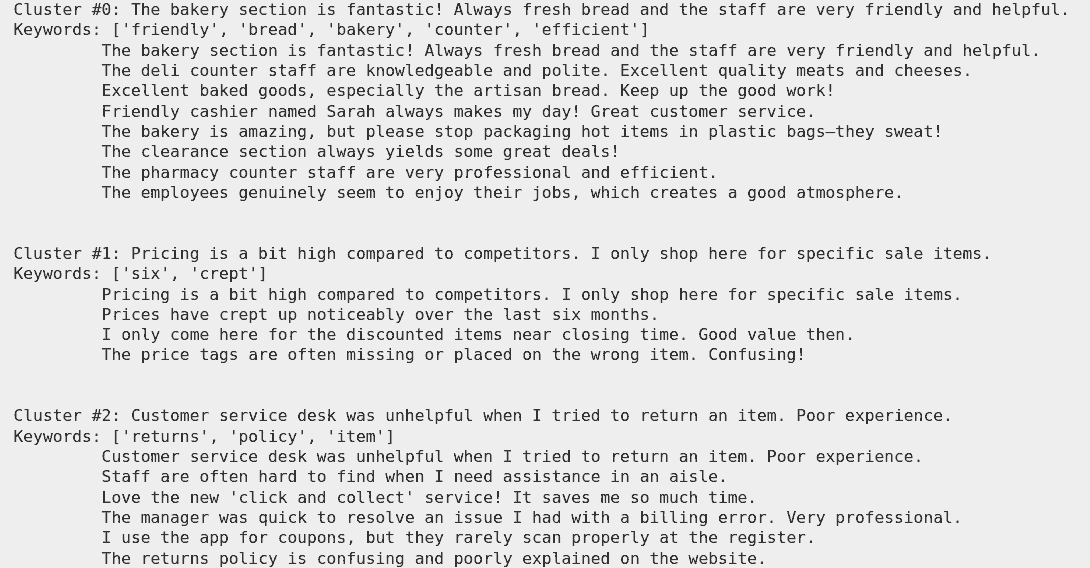
Each cluster is defined as the vectors and corresponding texts that it contains, however we don’t yet have an accurate topic summary of the classes.
At this stage, it’s possible to plot a bar chart showing the size of each cluster and the text at the centroid of each cluster:
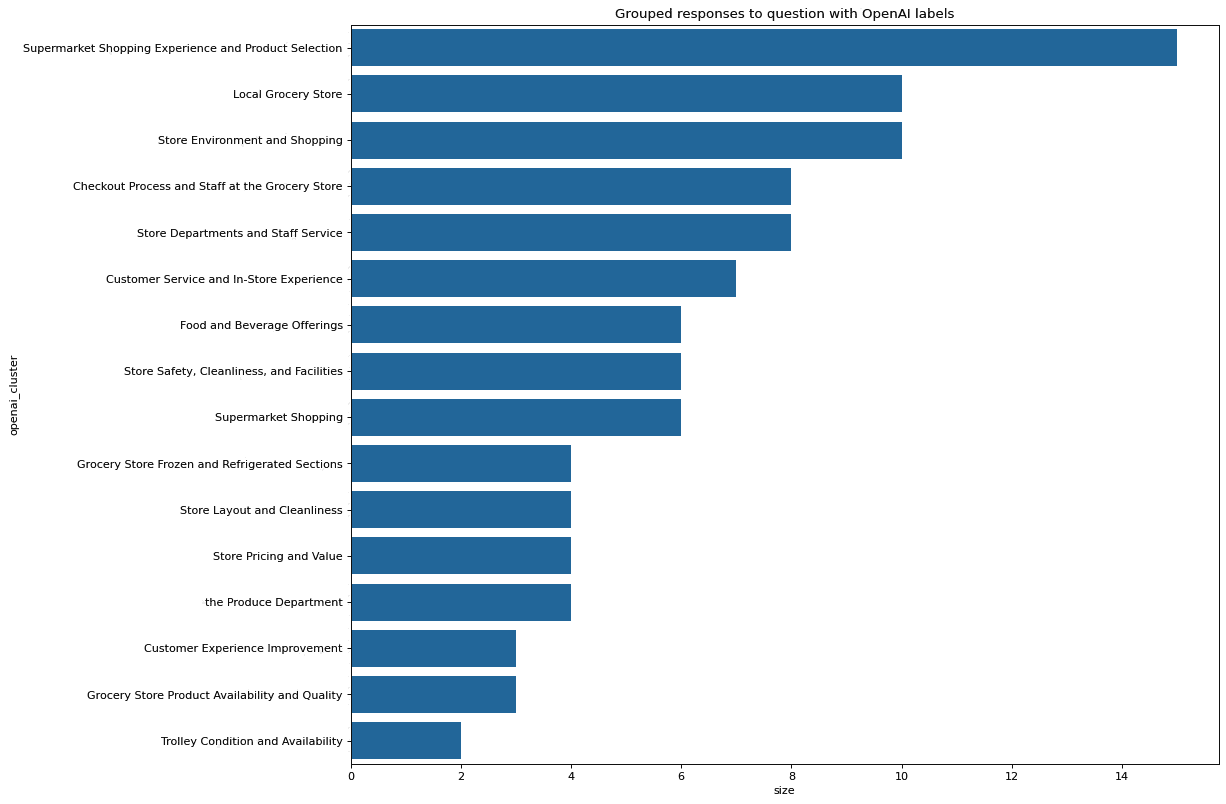
You can now take the clusters that were identified by Harmony and ask the OpenAI API to assign a topic header to each cluster. OpenAI seems to do this reasonably accurately.
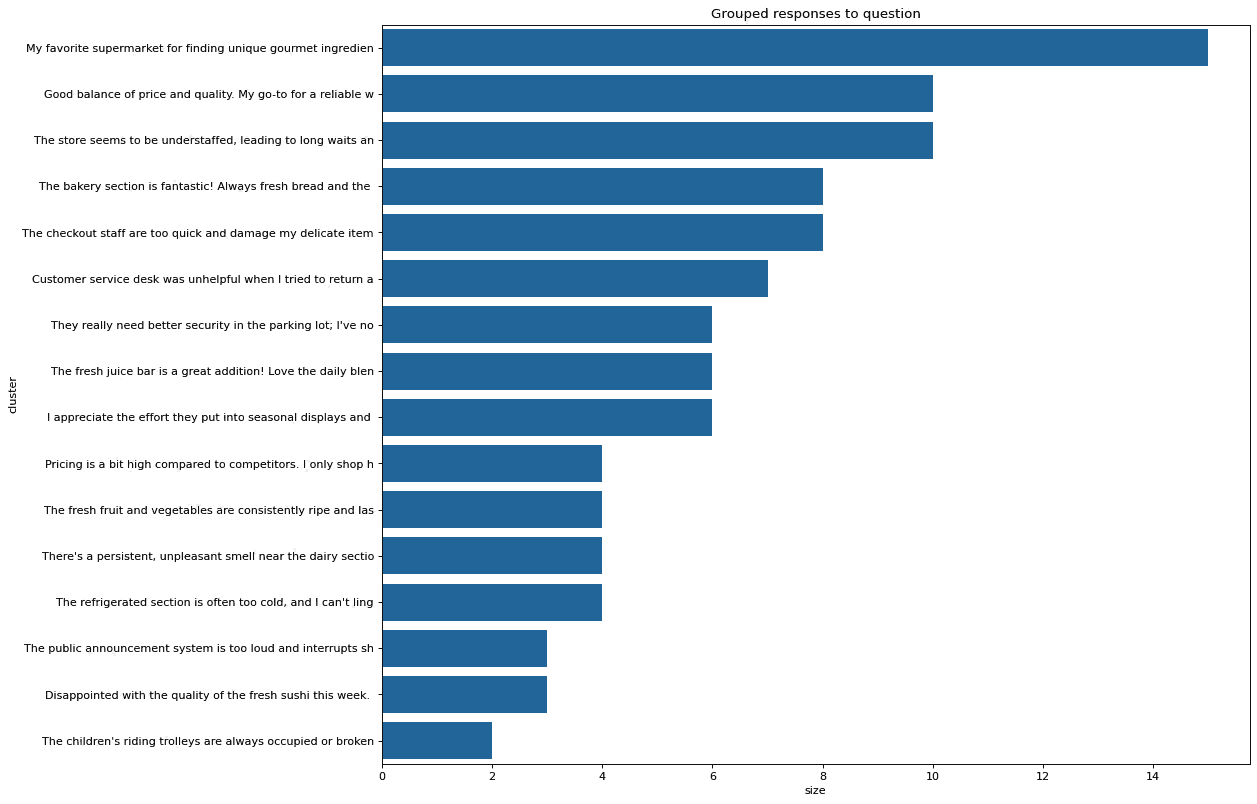
Below you can see the output of a bar chart after we have used open AI to refine the cluster names:
If you prefer to use Python you use this example Jupyter notebook which uses Harmony and OpenAI’s API to analyse the responses from an online customer survey for a fictional supermarket.
If you would like to work in R then Alex Nikic has prepared an R port of the same functionality here.
This reply is relevant whether you are dealing with questionnaires, focus group transcripts, employee surveys, NGO campaigns in the developing world, psychology research, or any other endeavour that results in large volumes of unsorted and unprocessed free text. The free text responses are often part of a larger survey with responses on numeric scales such as Likert scales.
We have undertaken previous projects like this in market research surveys, psychology questionnaires, and also in the non-profit space. Please feel free to contact us so that we can understand a bit more about what you are working on and come up with a technical approach and scope.
In short, we would apply a mixture of traditional NLP and statistical techniques, with more modern large language model and generative AI based approaches. We would start by eyeballing the data and looking for any patterns that jump out. Do customers from a particular location tend to mention a pain point more than you would otherwise expect? Are there demographic differences or patterns in the responses?
An easy way to get a gist for what’s in your data is to build a word cloud. We would generate a word cloud from word frequencies (excluding words like “the”) from all your responses together. We would then segment your data into the groups that are important to you (retained customers, customers from a long time ago, customers over 60, etc) and see if there are any obvious differences in the word clouds. We have successfully done this for a multinational bank and found that customers in particular groups found the online banking inaccessible, etc. We can also look for key named entities that are mentioned such as competitor banks, supermarkets, etc.
We would then proceed to use clustering algorithms to identify key topics in the data. A clustering algorithm would group topics and we could use large language models to assign descriptive labels to the topics. We have a demonstration of how you can do this for a retail business in our blog post on finding topics in free text survey responses .
Finally, we would be able to put together bar charts and pie charts and an human readable report with an executive summary detailing our findings. We would do all of this with a focus on your business objectives, e.g. expanding into a new market, reducing customer churn, improving customer on-boarding, etc. None of our final report or any text or document that we send to you will be AI generated.
If you’re interested in analysing your customer survey yourself, you can try this example Jupyter notebook which uses the open source library Harmony (https://github.com/harmonydata/harmony) and analyses some synthetic customes survey responses: https://github.com/harmonydata/harmony_examples/blob/main/tw_analyse_clusters_with_harmony.ipynb
Finally, if needed, we can produce and deploy an NLP dashboard which allows users to visualise your responses in an interactive graph. Think PowerBI or Tableau, but for text data. This solution is especially helpful if you have a lot of text data coming in regularly, and you want members of the public or your organisation to be able to explore your data.
Looking for experts in Natural Language Processing? Post your job openings with us and find your ideal candidate today!
Post a Job
Unlock your business potential with expert AI consulting services from Fast Data Science. Discover strategies to accelerate growth and outperform competitors.

Financial advisors, like lawyers, are regulated in the UK. All financial advisors should be registered with the Financial Conduct Authority (FCA) and must have certain qualifications and have signed up to a code of ethics. UK financial advisors must also complete professional training every year.
What we can do for you
